READMITTED: How America's Hospitals Are Failing the 30-Day Standard
11,720 hospital-condition pairs under CMS HRRP: which states, conditions, and ownership types still exceed the 30-day readmission benchmark — and what that means for TEAM in 2026
The Hospital Readmissions Reduction Program is a Medicare penalty system that has been running since 2012. The premise is simple: if your patients come back to the hospital within 30 days of discharge at a higher rate than expected given their medical profile, CMS docks your Medicare reimbursements. The penalty caps at 3% of all Medicare payments — not just payments for the specific condition being measured. A hospital with too many heart failure readmissions doesn’t just lose heart failure revenue. It loses 3% of everything.
The core metric is the Excess Readmission Ratio, or ERR. It is a ratio of predicted readmissions to expected readmissions — where “expected” is risk-adjusted for each patient’s age, comorbidities, and discharge history. An ERR of exactly 1.0 means you readmitted exactly as many patients as a hospital of your type and patient mix should. Above 1.0 means more readmissions than expected. Below 1.0 means fewer. What this analysis found: nearly every condition’s national average ERR is above 1.0. HRRP has been running for over a decade, and the average American hospital is still readmitting more patients than CMS expects. The penalty hasn’t eliminated the problem. It has clarified it.
FAST FACTS
DATASET CONTEXT
The FY2025 HRRP supplemental extract covers the measurement window used for CMS’s published excess readmission ratios. After removing suppressed rows — hospitals with fewer than 25 discharges for a given condition, which CMS redacts to protect patient privacy — the working dataset contains 11,720 hospital-condition pairs across roughly 2,700 hospitals and six conditions: Acute Myocardial Infarction (AMI), Heart Failure, Pneumonia, Chronic Obstructive Pulmonary Disease (COPD), Hip & Knee Arthroplasty, and Coronary Artery Bypass Graft (CABG). A hospital can perform well on five tracks and still take a hit on one.
The suppressed rows matter. Small rural hospitals disproportionately fall below the 25-discharge threshold and disappear from the analysis. The hospitals in this dataset skew toward larger, busier facilities. That is not a flaw in the extract — it is a feature of how CMS designed the program — but it shapes every finding below.
An ERR above 1.0 feeds a penalty calculation; the tier depends on how far above 1.0 a hospital sits relative to peers. For this report, pairs are grouped into four tiers: No Penalty (ERR ≤ 1.0), Low, Medium, and High. Charts are rendered in R from the working CSVs in this monorepo (articles/readmitted/data/), with PNG and interactive Plotly JSON exported side by side. Ownership labels for Chart 3 were joined from CMS Hospital General Information (dataset xubh-q36u) and stored offline so the analysis does not depend on a live CMS download at render time.
How to read this report: start with the chart claim, then ask what the metric means for a discharge planner, a hospital CFO, and a CMS actuary. The useful output is not memorizing every state percentage — it is leaving with a sharper question about where the 30-day window still fails.
THE GEOGRAPHY OF FAILURE
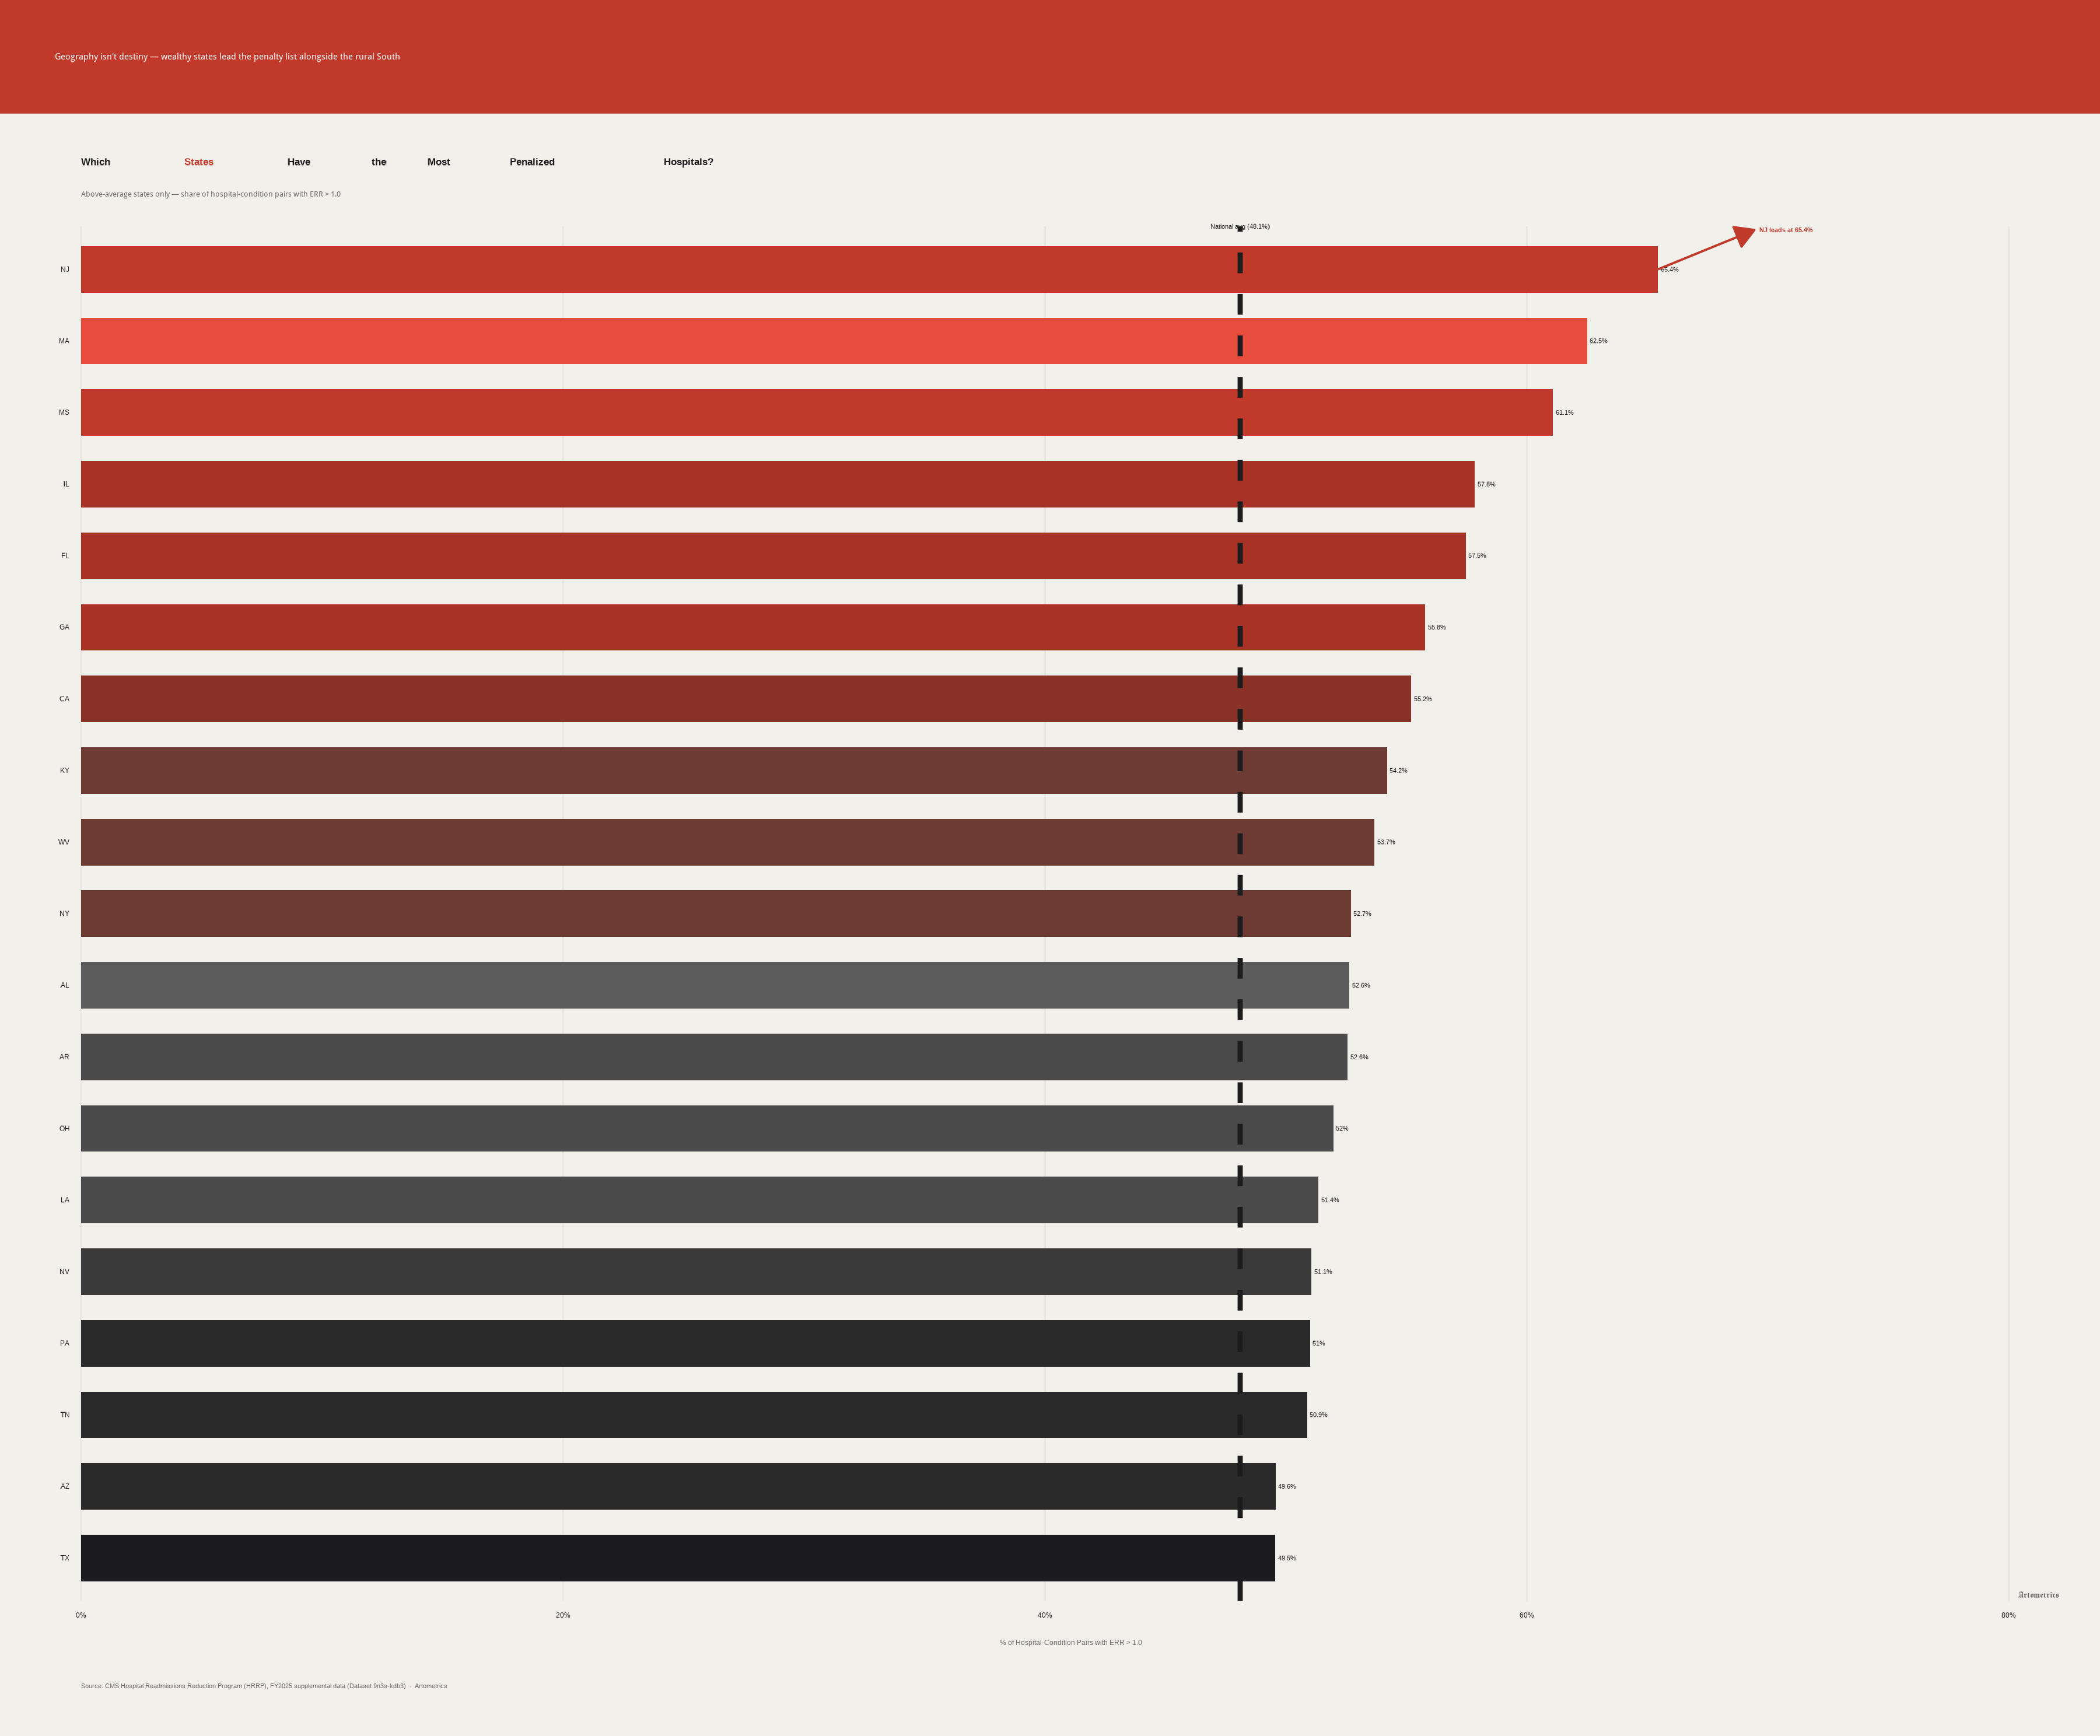
Nearly half of all hospital-condition pairs in this dataset carry an excess readmission ratio above 1.0. That national average hides the real story: the penalties are not evenly distributed.
The Southern poverty story doesn't hold
New Jersey leads the country at 65.4% — nearly two of every three hospital-condition pairs in the state perform worse than CMS models expect. Massachusetts (62.5%) and Mississippi (61.1%) follow. New Jersey hosts high-revenue systems such as Hackensack Meridian and RWJBarnabas; Massachusetts concentrates academic medical power around Mass General Brigham; Mississippi is rural, high-poverty, and chronically under-served. Different systems, different patient mixes, same penalty outcome.
The South over-indexes, but doesn't own the problem
Georgia, Kentucky, West Virginia, Alabama, and Louisiana cluster high — which fits the familiar population-health narrative. So do Illinois, California, New York, and Pennsylvania. This is not a rural-poverty map with a clean boundary. High-resource markets do not immunize a system.
Below average still means penalized
Chart 1 shows only states above the national average — the cohort pulling the 48.1% mean up. Even below-average states are not clean. “Below average” means a smaller share of pairs exceed ERR 1.0, not zero penalties.
THE CONDITION NOBODY IS SOLVING
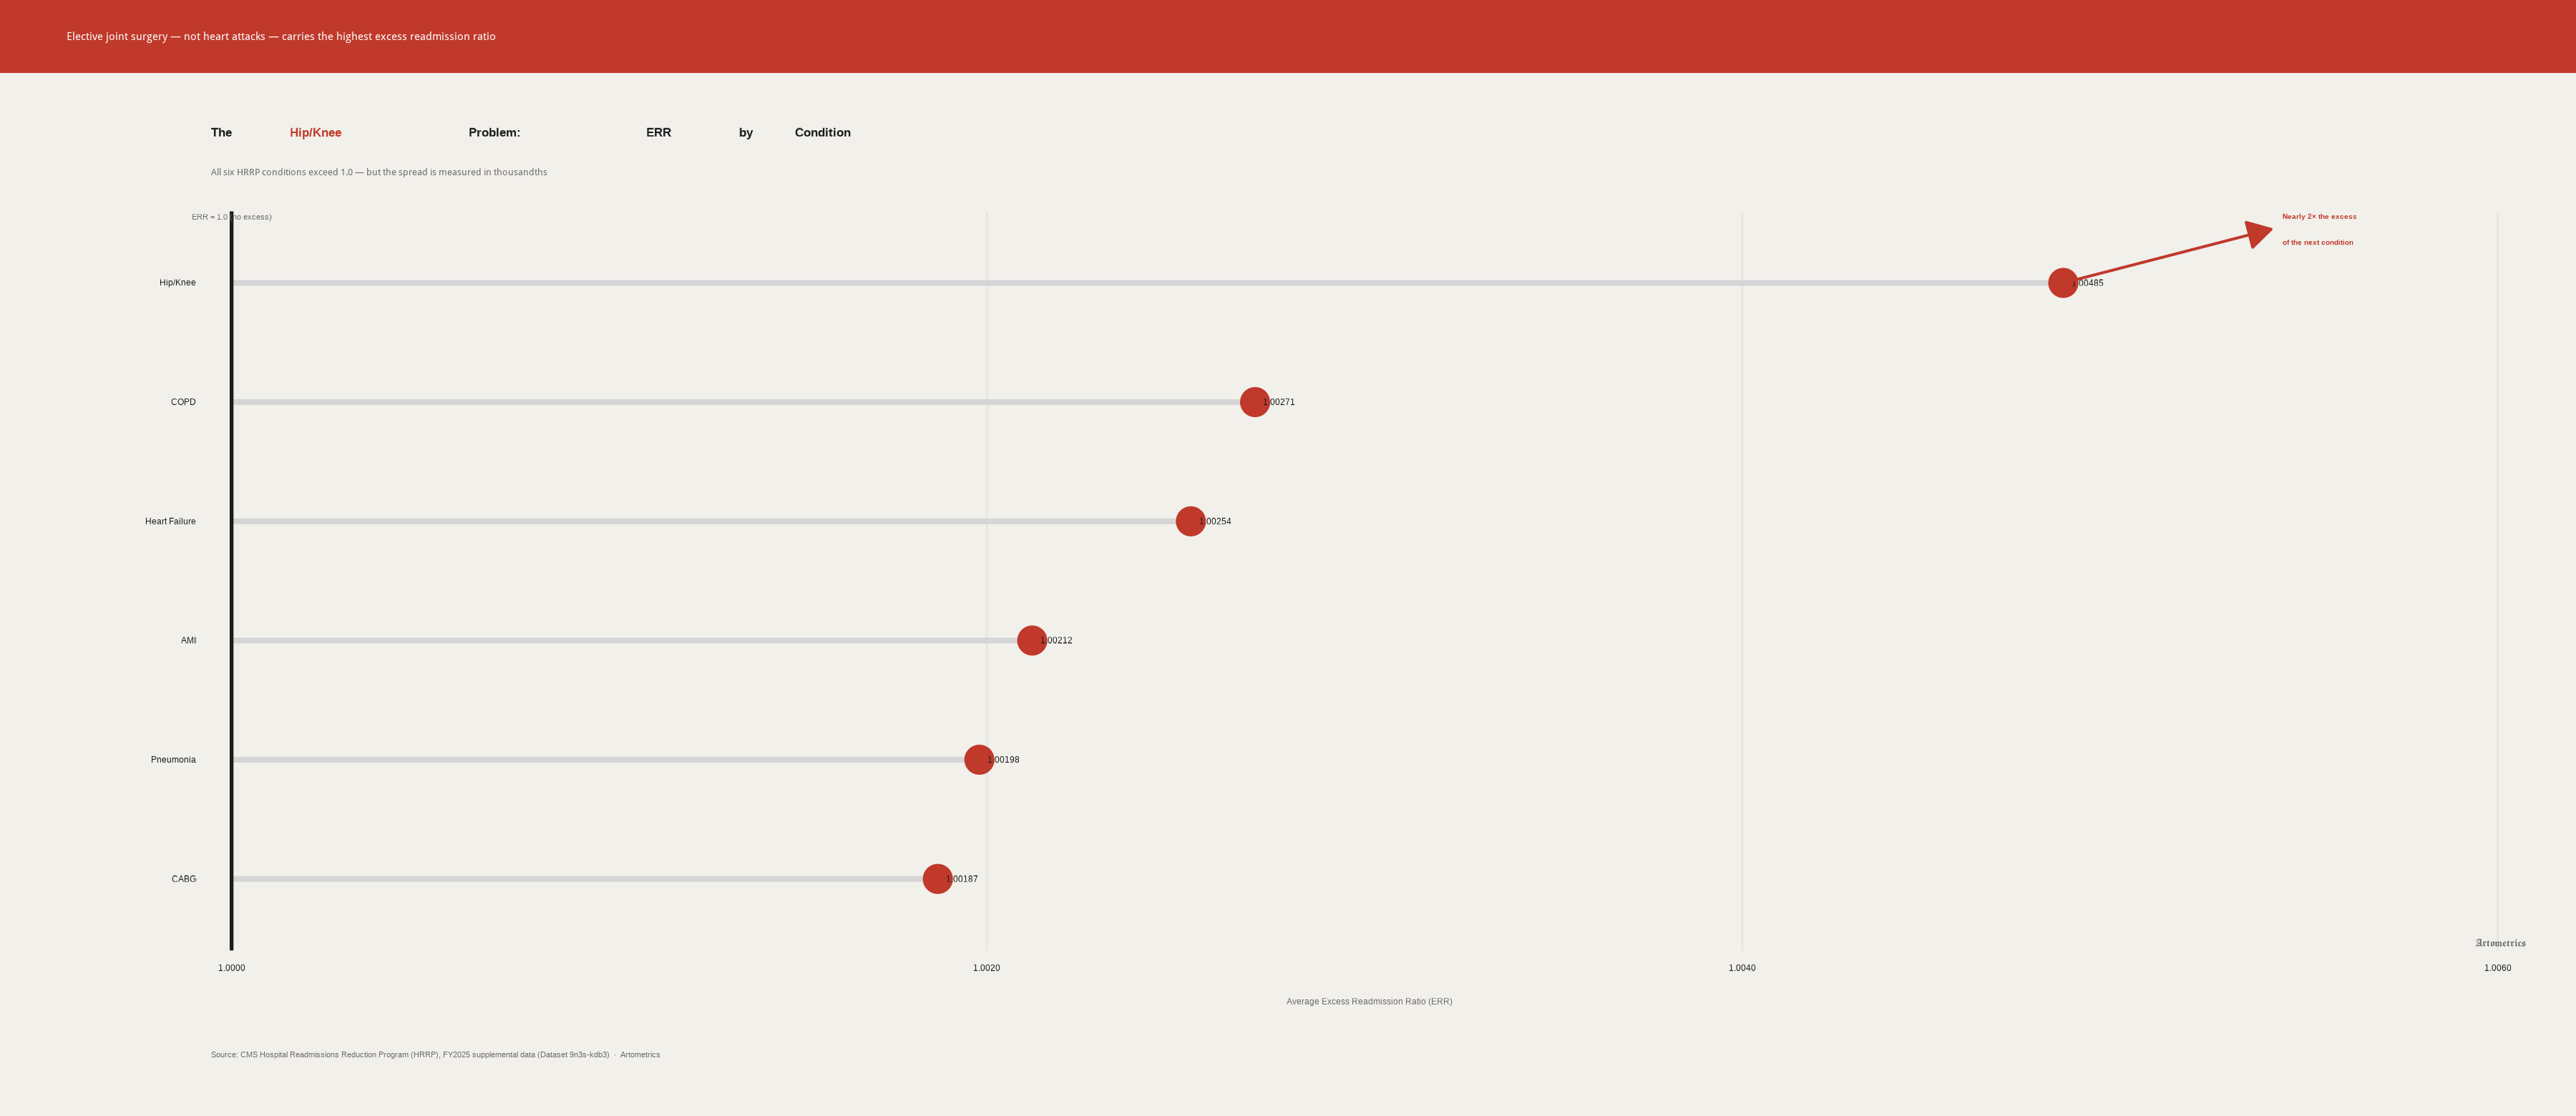
All six conditions tracked under HRRP carry an average excess readmission ratio above 1.0. One stands apart.
Twelve years of penalties haven't reset the baseline
Every tracked condition still averages above 1.0. The national mean ERR is 1.0018. Readmission rates have declined since 2012, but the program has not eliminated excess returns — it has measured them.
Hip/Knee is the outlier
Hip and knee replacement patients are readmitted at nearly twice the excess rate of the next closest condition. Hip/Knee’s average ERR of 1.00485 sits above COPD (1.00271), Heart Failure (1.00254), AMI (1.00212), Pneumonia (1.00198), and CABG (1.00187). The gaps live in the fourth decimal place — and still matter when multiplied across roughly 1.3 million U.S. joint replacements a year. Elective joint surgery shifts the danger window into post-discharge days hospitals cannot monitor as stays shorten.
COPD's low rank is a modeling artifact
COPD sits near the bottom of this chart, but that is not a success story. COPD patients return at high rates in absolute terms. The lower ERR means CMS’s risk model expects a sicker baseline. The bar is lower because the patients are harder — not because outcomes are better.
OWNERSHIP, PENALTY, AND WHO PAYS
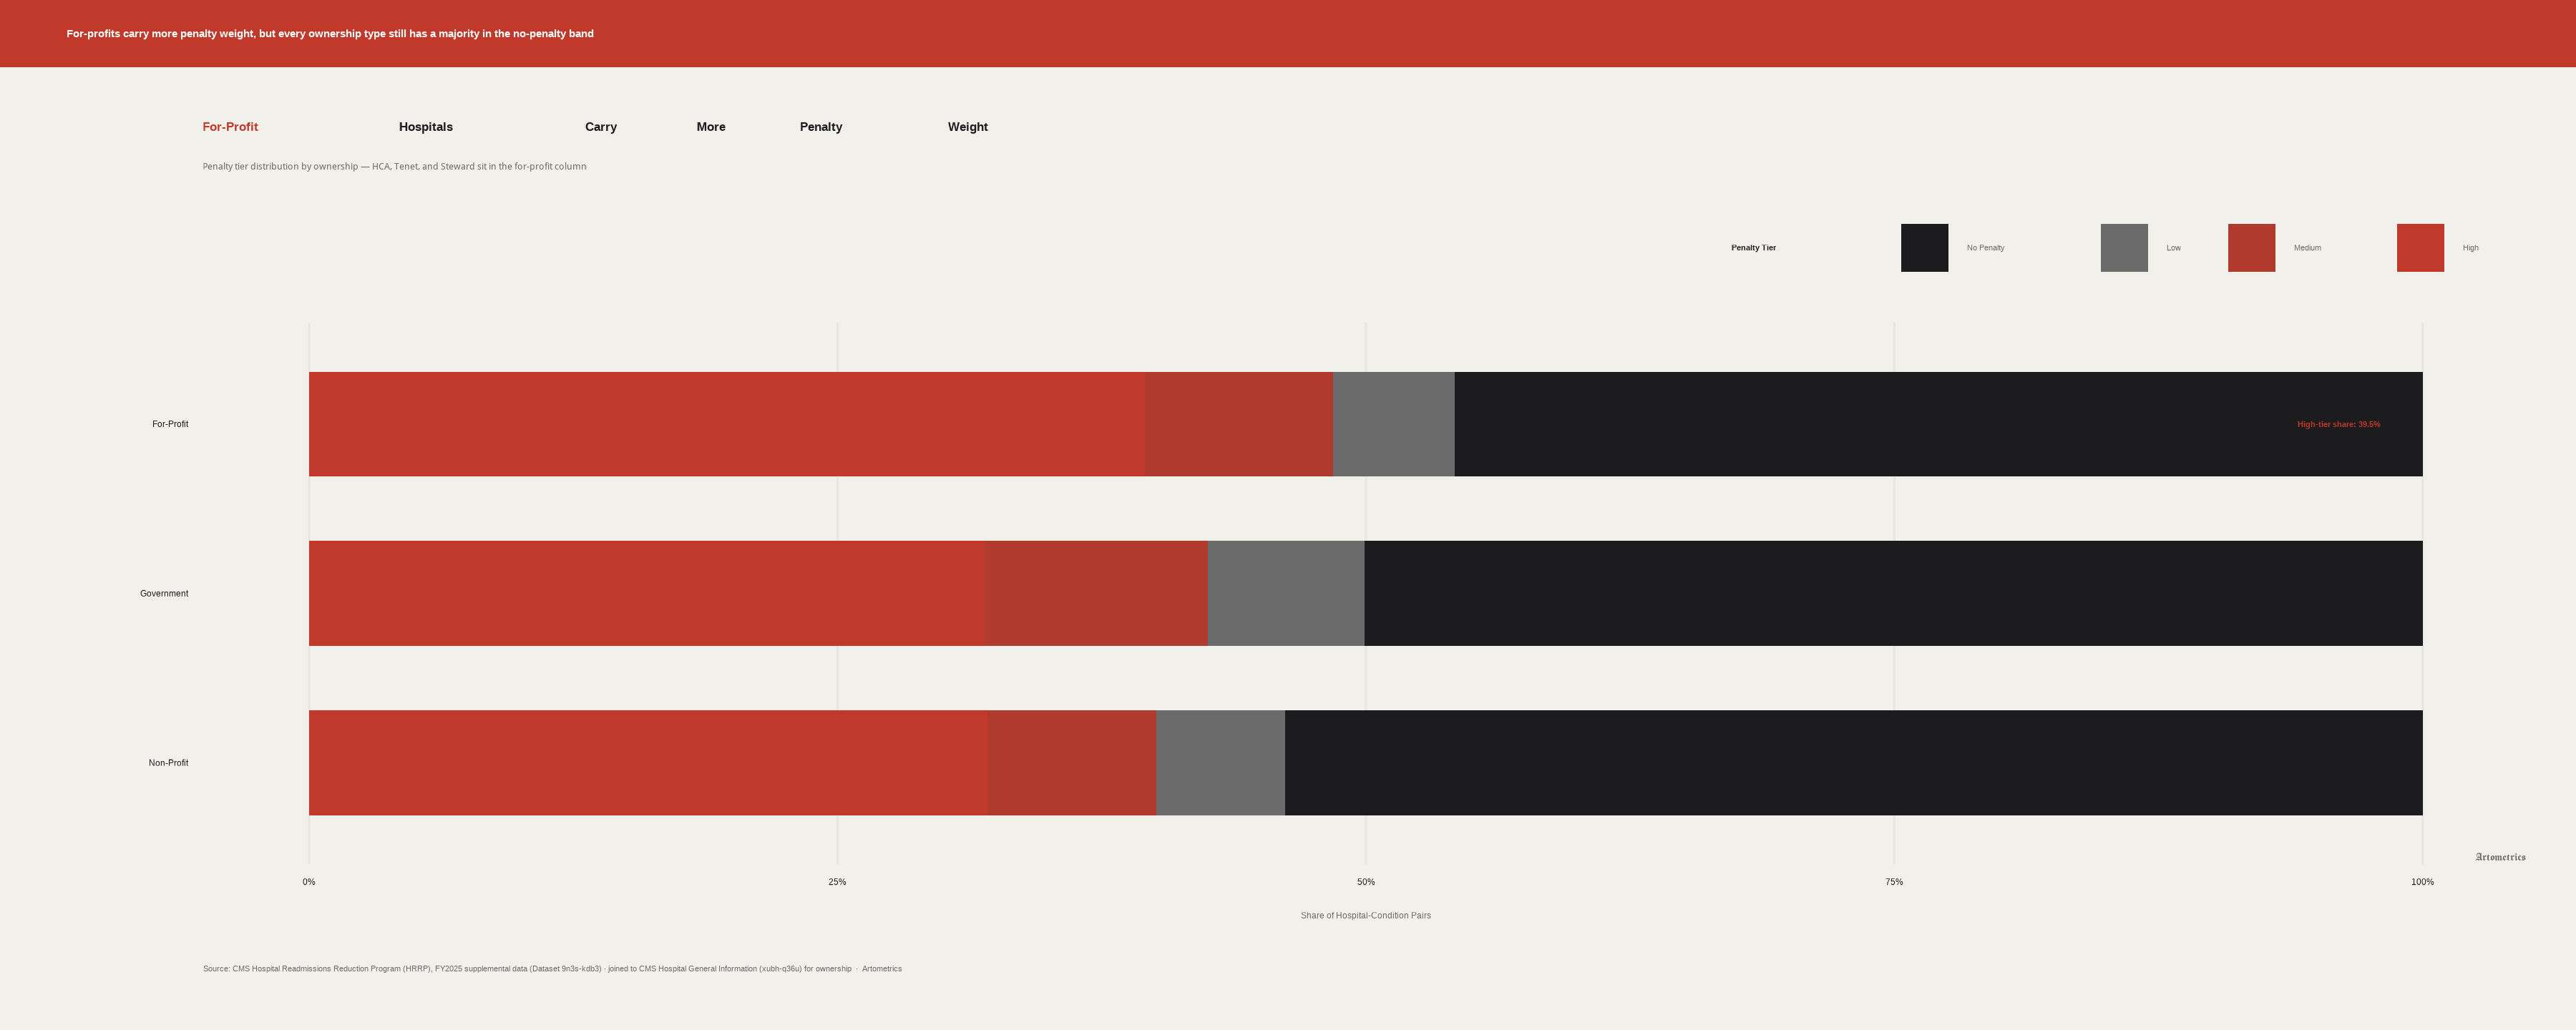
For-profit hospitals carry a higher share of medium and high penalty tiers than either non-profits or government hospitals. The policy debate often oversimplifies who is actually paying.
HRRP is selective, not universal
Every ownership type has roughly half or more of its hospital-condition pairs at or below the CMS expected readmission rate. HRRP is often described as a blanket stick. The data says the stick is concentrated — closer to an audit sampling than a universal fine. Systems such as HCA, Tenet, and Steward sit in the for-profit column; that does not mean every for-profit campus is High-tier.
For-profits lead — but only by degree
The gap is real — on the order of 8 to 10 percentage points more penalized pairs than non-profits — but it is a difference of degree, not kind. All three ownership types are playing the same game. For-profits lose it slightly more often.
Government hospitals sit in the middle
Government-owned facilities land between non-profit and for-profit. Neither the safety-net excuse nor the public-accountability story fits cleanly. County systems operate under political oversight that can slow discharge innovation; middle-of-pack performance is its own finding.
LIMITATIONS
CMS suppresses readmission data for hospitals that fall below 25 discharges per condition per measurement period. That threshold protects statistical reliability, but the effect is systematic — small rural hospitals disappear from this analysis. The hospitals remaining skew toward larger, busier facilities.
Ownership classification for Chart 3 comes from CMS Hospital General Information, which uses inconsistent labeling across hospital types. Physician-owned facilities, tribal hospitals, and church-affiliated systems do not always map cleanly into three buckets. The Government, Non-Profit, and For-Profit groupings are reasonable approximations — not clean legal categories.
ERR compares actual readmissions to what CMS’s risk model predicts for a hospital’s patient mix. Case-mix adjustment is imperfect. Hospitals in high-poverty, high-comorbidity markets may still face structural disadvantage the model does not fully absorb. Observation-status shifts after the ACA (documented by Zuckerman et al., 2016) also mean some returns never appear as inpatient readmissions.
CONCLUSION
Nearly half of all hospital-condition pairs still exceed CMS’s expected readmission rate — but the distribution is uneven. The highest-penalty states cut across market type and regional demographics. Hip/Knee replacement sits nearly 2× above the next closest condition on excess readmissions. For-profit hospitals carry modestly more penalty exposure than non-profits, though all three ownership types remain majority no-penalty.
HRRP has been in effect since 2012. That 48.1% of pairs still clear the 1.0 ERR threshold more than a decade later says something about the limits of financial penalties as a behavior-change mechanism. Hospitals have responded — rates have declined — but the program has defined the problem more than it has solved it.
CMS’s TEAM model, mandatory for 742 hospitals starting January 1, 2026, goes further by tying entire episodes of care to reimbursement. The hospitals that struggled under HRRP are the ones most likely to feel TEAM. This report describes the problem TEAM is designed to address. Whether bundled payments succeed where readmission penalties have not is the next question.
REFERENCES
Centers for Medicare & Medicaid Services. Hospital Readmissions Reduction Program (HRRP) — FY2025 Supplemental Data. CMS Provider Data Catalog, Dataset ID: 9n3s-kdb3. https://data.cms.gov/provider-data/dataset/9n3s-kdb3
Centers for Medicare & Medicaid Services. Hospital General Information. CMS Provider Data Catalog, Dataset ID: xubh-q36u. https://data.cms.gov/provider-data/dataset/xubh-q36u — joined to HRRP data for ownership classification in Chart 3.
Centers for Medicare & Medicaid Services. (2024). Transforming Episode Accountability Model (TEAM). https://www.cms.gov/priorities/innovation/innovation-models/team — mandatory participation effective January 1, 2026 for 742 hospitals.
Medicare Payment Advisory Commission. (2024). Report to the Congress: Medicare Payment Policy, Chapter 9 (hospital inpatient and outpatient services; readmissions discussion). https://www.medpac.gov
Zuckerman, R.B., Sheingold, S.H., Orav, E.J., Ruhter, J., & Epstein, A.M. (2016). Readmissions, observation, and the Hospital Readmissions Reduction Program. New England Journal of Medicine, 374(16), 1543–1551. https://doi.org/10.1056/NEJMsa1513024
Krumholz, H.M., et al. (2017). Relationship between hospital readmission and mortality rates for patients hospitalized with acute myocardial infarction, heart failure, or pneumonia. JAMA, 318(3), 270–278. Background on readmission–mortality tradeoffs under quality measurement.
FILES
Download the working datasets and chart exports used in this report. All files are hosted on this site — no external repo required.
Datasets
- hrrp_state_summary.csv — state-level penalty share and average ERR
- hrrp_condition_err.csv — average ERR by HRRP condition
- hrrp_ownership_condition.csv — ownership × condition × penalty tier counts
Charts (PNG)
Charts (Plotly JSON)
EDITOR’S NOTE
This report was researched, written, designed, and produced in active collaboration with Claude AI (Anthropic). The data pipeline, statistical analysis, chart design, written analysis, narrative structure, and visual styling were all developed through a directed partnership between human editorial judgment and AI execution. Charts are exported from R in this monorepo (articles/readmitted/). Artometrics was built on the premise that rigorous analysis and honest process are not in conflict. The research questions, editorial instincts, interpretive framing, and brand vision are ours. We document this not as a disclaimer but as a description of how we actually work.
— Artometrics Editorial