



JUN 15, 2026 · Airlines
Airlines
How Incident Counts Hide Exposure Differences
336 airline records show capacity dominates safety rankings—United leads at 7.1B seat-km/week, but incident counts don't scale linearly with size.
By Kyle McAuliffe · · 4 min
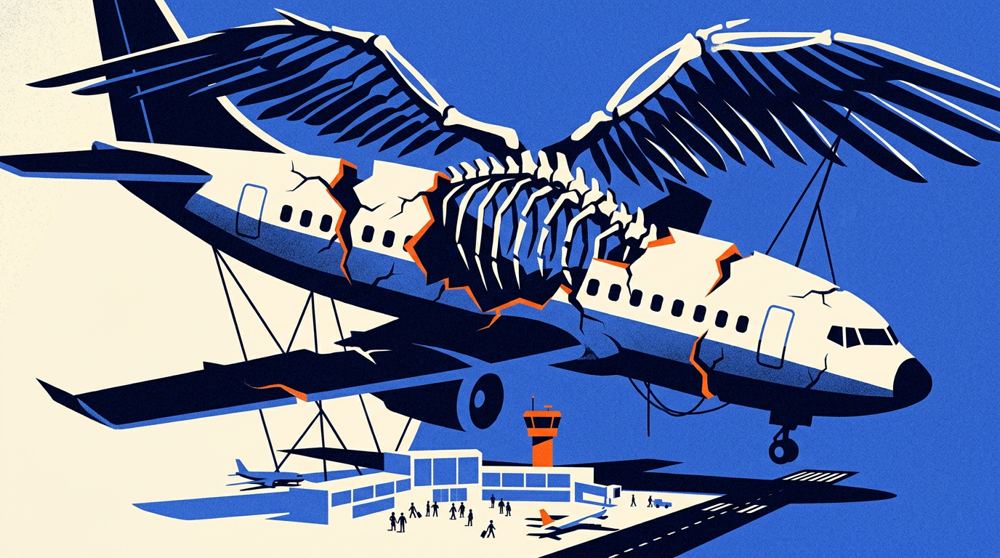
Airline safety is usually discussed one crash at a time. The TidyTuesday airlines dataset does something different: it aligns carriers by available seat kilometers per week—a capacity metric—and then asks how incidents, fatal accidents, and fatalities sit against that scale. The working file contains 336 cleaned records after merging the week's tables.
Capacity is not the same as risk, but it is the right denominator for a fair first cut. A carrier flying 7.1 billion available seat kilometers per week operates in a different exposure class than one flying under 2 billion. The median in this extract is 802,908,893 available seat kilometers per week—a baseline for interpreting every ranking that follows.
The most common event type in the file is labeled incidents. That distinction matters: the archive mixes routine reportable events with rarer fatal outcomes, and conflating those categories would obscure the real story.
336
Records in the working dataset
802,908,893
Median available seat-km per week
7,139,291,291
Highest observed available seat-km per week
Capacity Concentrates Among Megacarriers
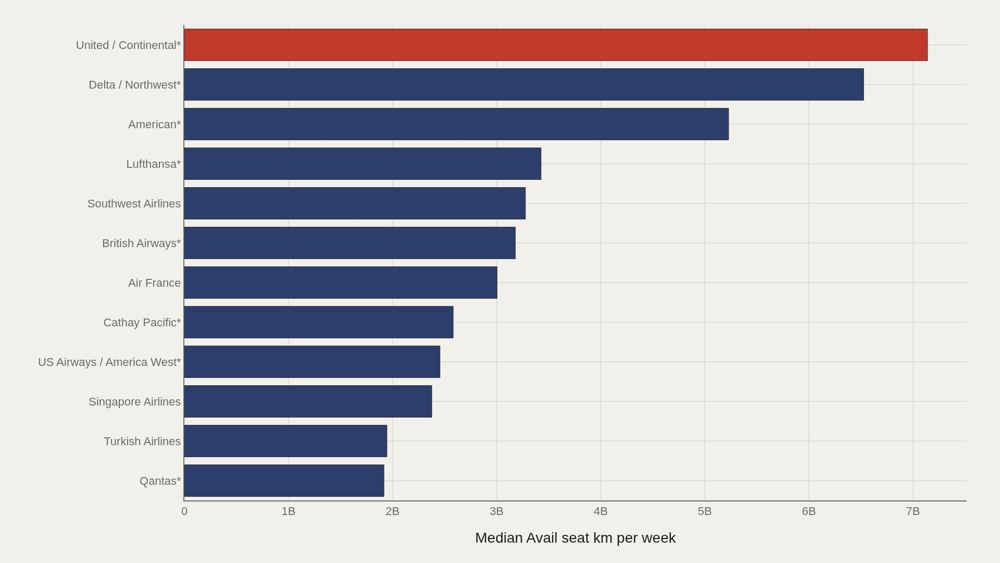
United/Continental* anchors the top at 7,139,291,291 available seat kilometers per week. Delta/Northwest* follows at approximately 6.53 billion, then American* at 5.23 billion. The next tier—Lufthansa*, Southwest, British Airways*, Air France—occupies the 3.0 to 3.4 billion range. That gap is structural. The top three merged U.S. brands operate at a different scale than even large European flag carriers in this extract. When event counts are later compared across airlines, those capacity differences provide essential context.
The Same Names Dominate the Leader Board
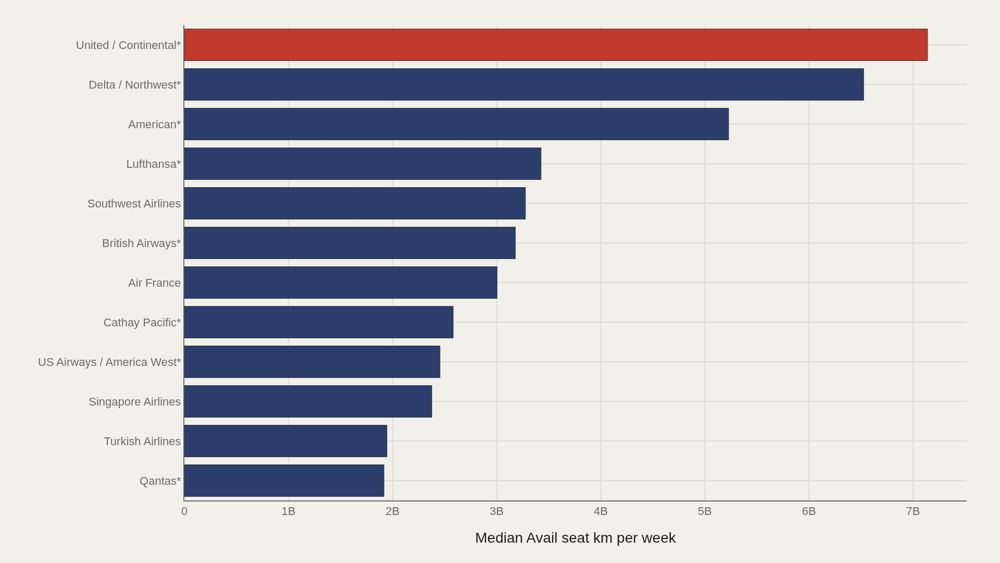
The leaders chart restates the capacity hierarchy with precision: United/Continental* leads at 7,139,291,291, while the median among the top dozen sits near 3,091,881,806. Half of the top tier still operates at less than half the leader's scale. Large airline is not a single category. It is a steep pyramid. Any analysis that ranks raw incident counts without accounting for this pyramid will systematically penalize the largest networks.
Event Type Does Not Rewrite the Capacity Story
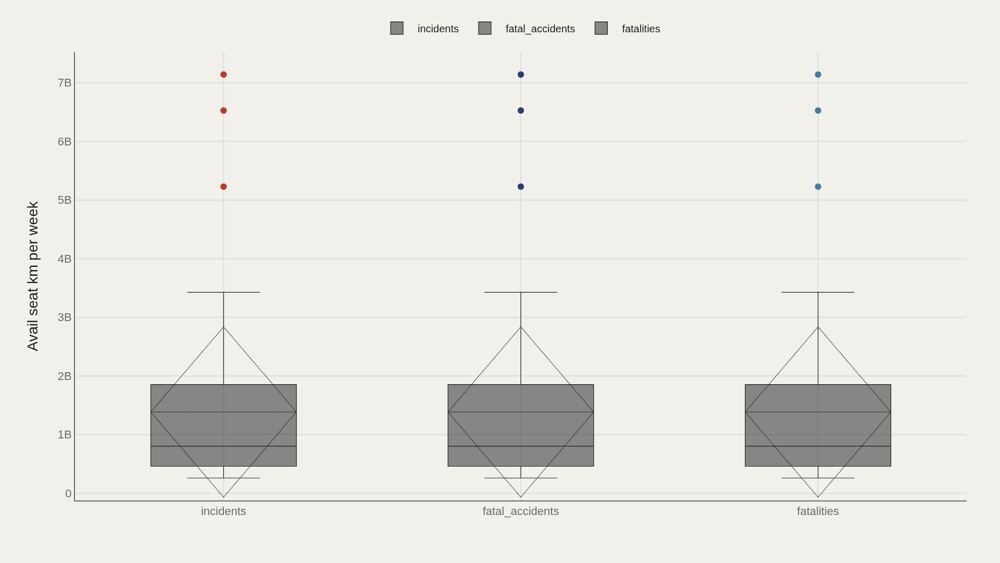
Box plots separate available seat kilometers by event type—incidents, fatal_accidents, and fatalities. Each group shows the same median of 802,908,893 and the same maximum of 7,139,291,291 across 112 observations per box. That consistency is the finding. Event labels do not sort carriers into different capacity worlds; the same megacarrier scale appears whether the row is marked as an incident or a fatality record. The distribution reflects who operates the most seat-kilometers, not which label the row carries.
Gaps to the Median Are Flat Across Labels
When available seat kilometers are compared to the sample median by event type, incidents, fatal_accidents, and fatalities all register essentially zero gap. This is a stability check, not a ranking. The chart's purpose is to rule out a false narrative: that one event category concentrates among unusually large or unusually small carriers. In this extract, the labels do not shift capacity away from the median.
Scale and Event Counts Do Not Move as One Line
Plotting available seat kilometers against event count reveals clusters that aggregate statistics erase. Some mid-size carriers report high incident counts; some of the largest networks register moderate totals relative to their seat-kilometer footprint. The fatality panel is particularly uneven: the highest fatality totals are not always concentrated at the absolute capacity leaders. Exposure and outcome are related, but not linearly—which is why capacity and counts must be read together.
What to take away
The clearest finding is structural: a handful of megacarriers dominate available seat kilometers, with United/Continental* at the apex and a median near 803 million seat kilometers per week for the wider field.
Event-type labels do not reorder that hierarchy. The meaningful question is not which airline has the most recorded events—it is how those events scale against the seat-kilometers actually flown.
■ END
The Fine PrintBack of the BoxEnd Credits
NoteWarningsDisclaimer
Artometrics data brief. Figures come from the sources below. Derived shares and editorial indices are not audited financials.
SourcesContentsSources
MethodAssemblyMethod
Numbers in this issue are the published figures. The skin changes type, rules, and chart color only.
PlatesMade byImage credits
- HeroArtometrics Airlines illustration.
- PlatePortrait of Luca Pacioli, attributed to Jacopo de' Barbari, c. 1495. Public domain, via Wikimedia Commons.
- PlateColor print of a toy shop, Utagawa Sadahide, 1860. The Metropolitan Museum of Art, CC0, via Wikimedia Commons.
- PlateBelasco Theatre box office, published November 1907 in Architects' and Builders' Magazine. Unknown photographer. Public domain, via Wikimedia Commons.


Updated through JUN 15, 2026.