



JUN 15, 2026 · Alcohol
Alcohol
Who Drinks the Most Per Capita?
Country-level consumption data map which nations drink the most per person—and how that has shifted.
By Kyle McAuliffe · · 5 min
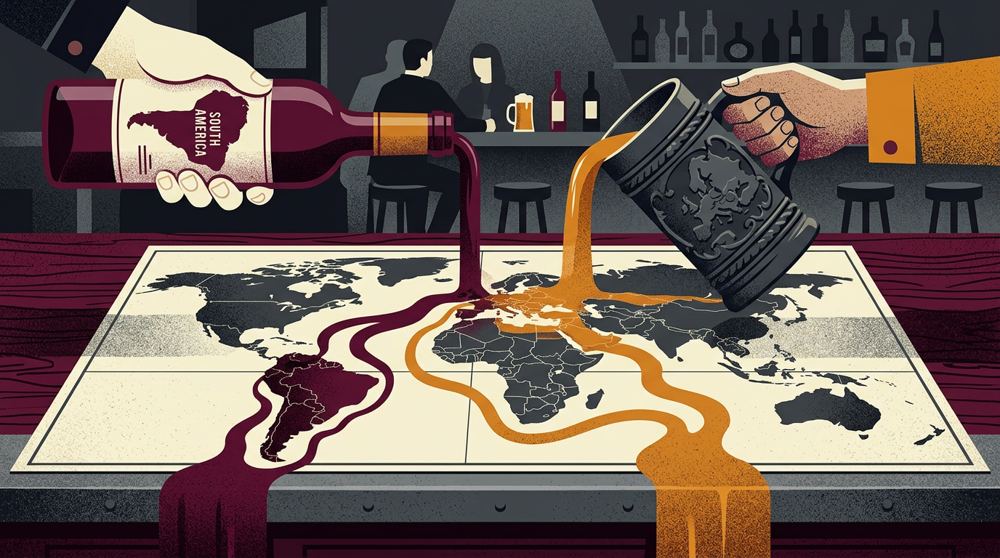
Global alcohol data is often collapsed into a single “drinks per person” headline. The TidyTuesday global alcohol extract keeps the beverage split intact — beer, spirits, and wine servings — across 193 country-level records. Beer is the metric that leads these charts, with a median of 76.0 servings and a recorded high of 376 in Namibia.
193
Records in the working dataset
76.0
Median Beer servings
376
Highest observed Beer servings
Beer Consumption Has a Steep Country Ladder
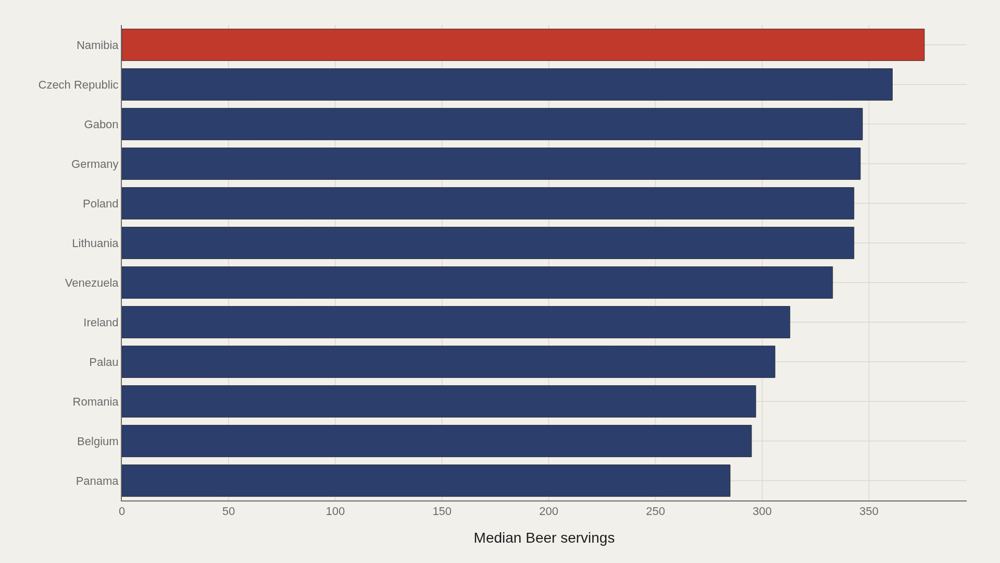
Namibia leads the beer ranking at 376 servings, followed by the Czech Republic at 361, Gabon at 347, and Germany at 346. Lithuania and Poland tie near 343. Ireland sits lower in the top dozen at 313. These are not clustered scores around the global median of 76. The leaders occupy roughly four to five times the typical country’s beer volume in this file — a reminder that beer culture is geographically concentrated, not evenly shared. The country names matter because they point to different beverage systems. Namibia and Gabon place African markets in the same high-beer conversation as the Czech Republic, Germany, Lithuania, Poland, and Ireland — countries often associated with long-standing brewing industries, beer taxation regimes, and pub or lager cultures. A single “Europe drinks beer” shortcut would miss the African leaders; a single “income predicts beer” shortcut would miss the spread across very different economies. The 2018 TidyTuesday file descends from World Health Organization alcohol indicators that summarize recorded servings rather than clinical outcomes. That distinction is important: a serving count can identify beverage concentration, but it does not measure binge patterns, liver disease, drunk-driving deaths, or unrecorded home output. The chart is strongest as a map of recorded beverage preference.
The Top Dozen Has Its Own Median
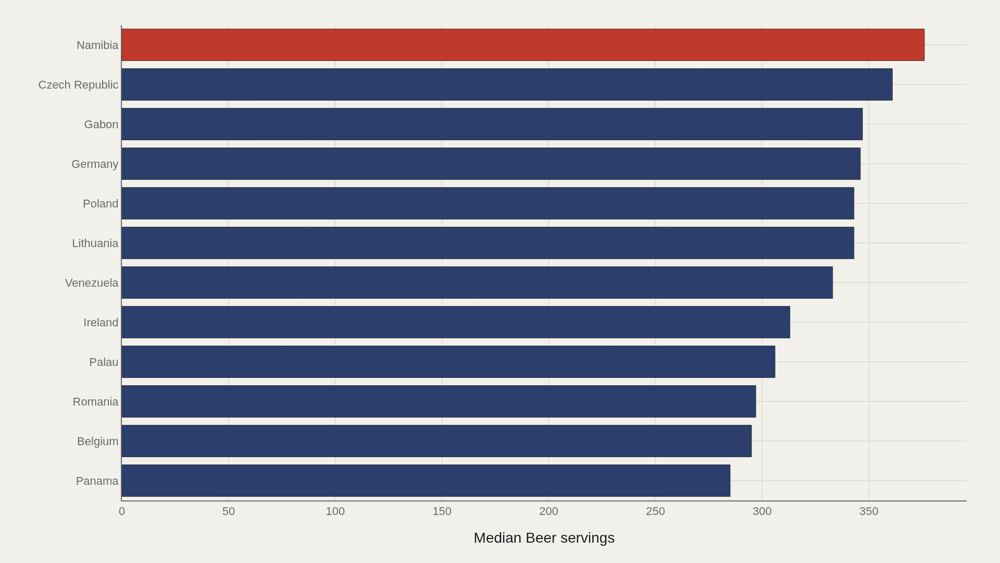
Among the top twelve beer countries, Namibia’s 376 still leads, while the median of that elite group is 338. Even inside the high-beer club, the distribution has a ceiling that most of the world never approaches. Reading only the global median would hide that club entirely. Reading only Namibia would hide how many Central European and other high-beer countries sit just behind it. The top-dozen median of 338 is almost as revealing as the maximum. It says the leaders are not one outlier and eleven ordinary countries; they are a compact high-consumption band. Czech, German, Lithuanian, Polish, and Irish entries sit in a historically industrial beer belt, while Namibia and Gabon remind us that contemporary beer markets also reflect colonial trade routes, urban retail systems, and modern commercial breweries. For public-health interpretation, this is where volume and harm begin to diverge. WHO and OECD alcohol reports usually emphasize liters of pure alcohol, age-standardized mortality, and sex-specific patterns because beverage-specific servings alone cannot compare the ethanol load of beer, wine, and spirits. This Artometrics cut keeps the serving metric because it asks a cultural-economy question first: where is beer, as a category, unusually dominant?
Most Countries Cluster Far Below the Peaks
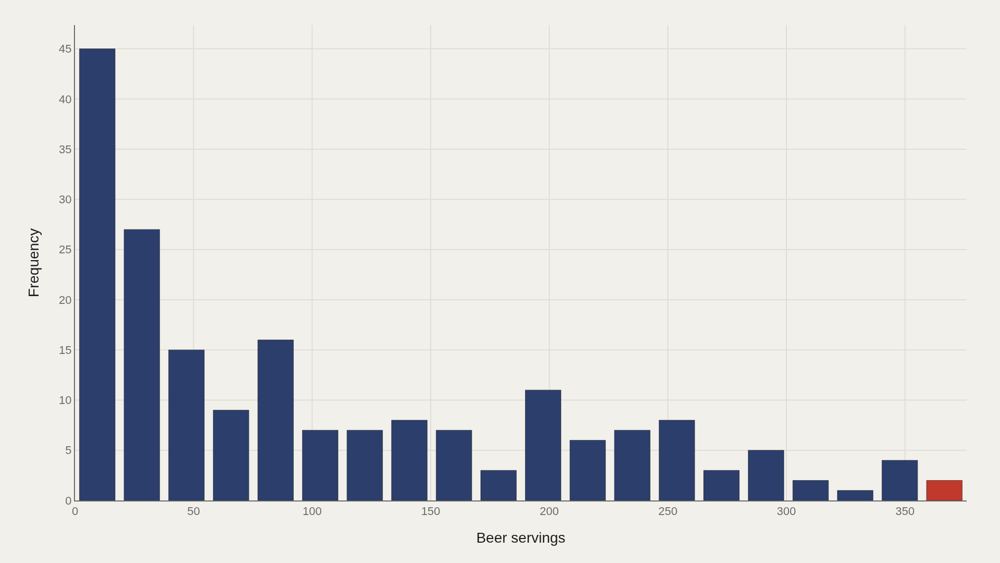
The distribution chart piles most countries into lower beer-serving bins. Counts peak in the low double-digit and mid-range bins, while the extreme high bins that hold Namibia and the Czech Republic contain only a handful of countries. That shape is why the median (76.0) is the right headline number: it describes the typical country, not the viral maximum. The skew also changes how readers should interpret “per capita” comparisons. A country can sit below the median because beer is less available, because spirits or wine dominate the market, because alcohol consumption is lower overall, or because religious and legal rules suppress recorded sales. Those mechanisms are not interchangeable, even if they all land in the same low-beer bins. The lower half of the distribution should therefore be read as a mixture of abstention, substitution, market structure, and reporting practice. In many Muslim-majority countries, for example, recorded beer servings will reflect legal and religious constraints as much as consumer taste. In wine-producing countries, the same low beer value may simply mean the alcohol profile has moved to another column.
What to take away
Beer consumption in this extract is a steep hierarchy: Namibia at 376 servings against a world median of 76. The top dozen forms its own high plateau around a median of 338.
■ END
The Fine PrintBack of the BoxEnd Credits
NoteWarningsDisclaimer
Artometrics data brief. Figures come from the sources below. Derived shares and editorial indices are not audited financials.
SourcesContentsSources
- SourceData Science Learning Community. (2018). TidyTuesday: Alcohol Consumption. https://raw.githubusercontent.com/rfordatascience/tidytuesday/main/data/2018/2018-06-26/week13_alcohol_global.csv
- SourceWorld Health Organization. (2018). Global status report on alcohol and health 2018. https://www.who.int/publications/i/item/9789241565639
- SourceWorld Health Organization. (2024). Global status report on alcohol and health and treatment of substance use disorders. https://www.who.int/publications/i/item/9789240096745
- SourceOECD. (2021). Preventing Harmful Alcohol Use. https://doi.org/10.1787/6e4b4ffb-en
- SourceRehm, J., et al. (2009). Global burden of disease and injury and economic cost attributable to alcohol use and alcohol-use disorders. The Lancet, 373(9682), 2223–2233. https://doi.org/10.1016/S0140-6736(09)60746-7
- ReportFull report: artometrics.com/alcohol
MethodAssemblyMethod
Numbers in this issue are the published figures. The skin changes type, rules, and chart color only.
PlatesMade byImage credits
- HeroArtometrics Alcohol illustration.
- PlatePortrait of Luca Pacioli, attributed to Jacopo de' Barbari, c. 1495. Public domain, via Wikimedia Commons.
- PlateColor print of a toy shop, Utagawa Sadahide, 1860. The Metropolitan Museum of Art, CC0, via Wikimedia Commons.
- PlateBelasco Theatre box office, published November 1907 in Architects' and Builders' Magazine. Unknown photographer. Public domain, via Wikimedia Commons.


Updated through JUN 15, 2026.