



JUL 1, 2026 · Exports
Exports
What Does Your Country Sell?
Export ledgers reveal national identity under market constraint—200+ countries, 5,000+ products, six diagnostic questions.
By Kyle McAuliffe · · 4 min
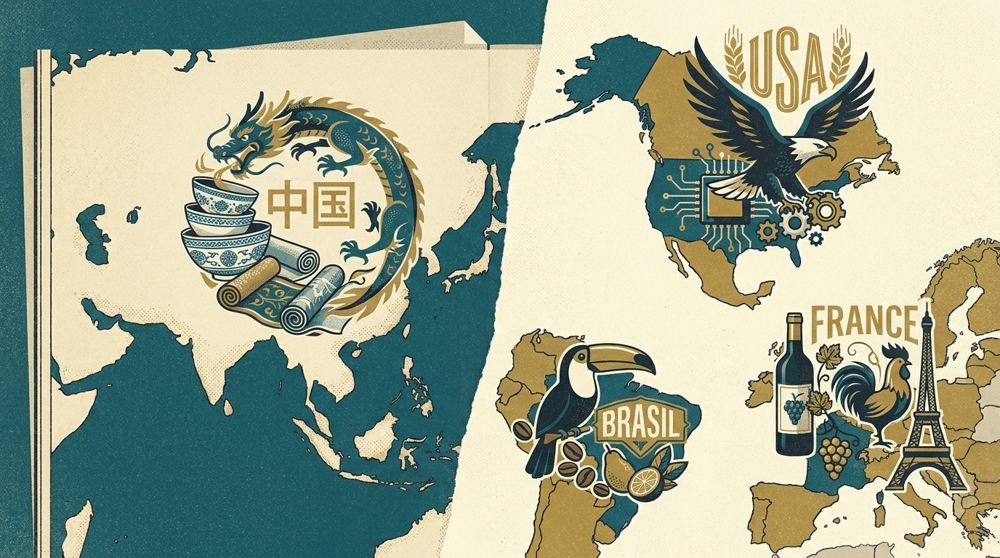
What a nation sells abroad is one of the few identity claims that must clear a market test. Tourism slogans can invent a self-image; export ledgers record what other countries will actually pay for.
UN Comtrade and OEC systems track 200+ countries and zones and 5,000+ products under Harmonized System codes. The atlas below uses 6 diagnostic questions to make identity readable without pretending the indices are final official rankings.
Scale and complexity are different virtues. A country can be large because it sells one thing in volume, or complex because it sells many hard-to-make things. Those identities behave differently under shock.
200+
Countries and zones covered in UN Comtrade systems, revealing what the world buys from each
5,000+
Products classified under OEC Harmonized System codes, separating complexity from commodity
6
Diagnostic questions that turn export data into identity analysis, from substitutability to prestige
Scale and complexity
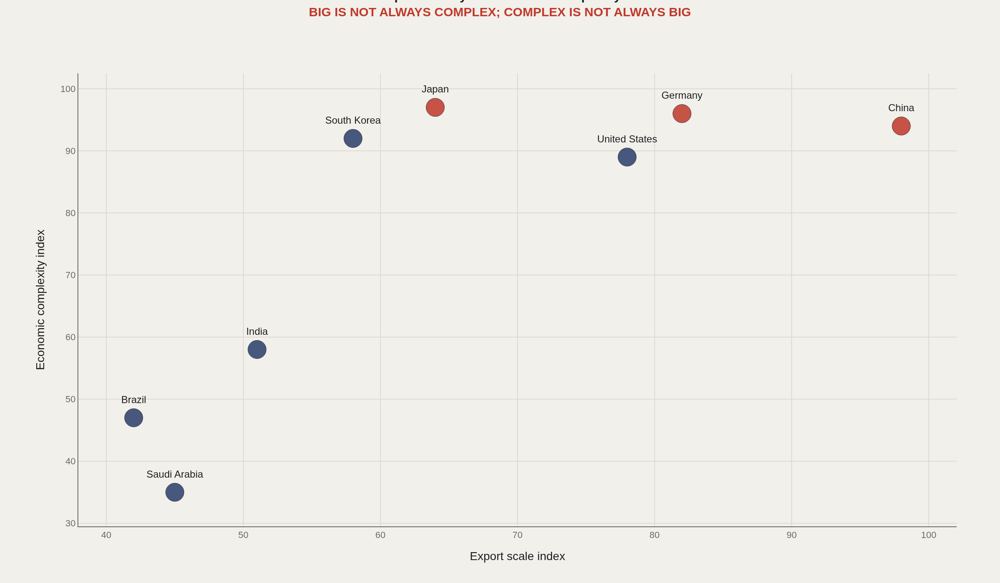
Exports reveal what a country can reliably make and sell into the world. Scale and complexity are different axes: volume without sophistication is one identity; sophistication without volume is another; both together is rarer. Countries plotted high on both dimensions occupy a different strategic neighborhood from resource giants that score high on scale alone. The chart stops those neighborhoods from being collapsed into a single big-exporter label.
Product identity
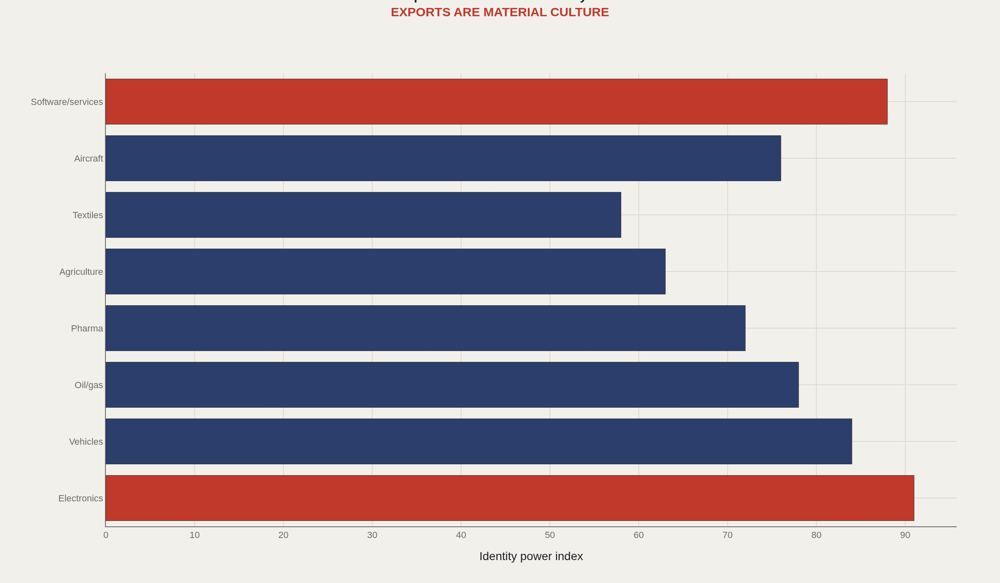
Cars, electronics, oil, pharmaceuticals, aircraft, software, agriculture, and textiles are not just commodities. They become reputational shorthand—Germany and machines, Saudi Arabia and energy, the United States and software services. Exports become part of national mythology when they are repeated long enough to feel like character. The data still matter because mythology that loses market share eventually becomes nostalgia.
The export frontier moved
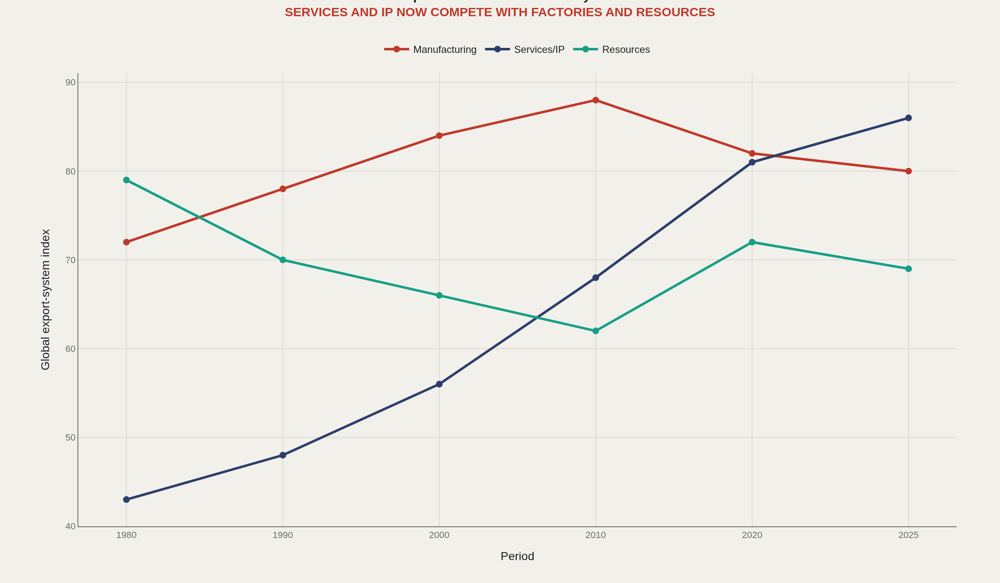
The last generation of globalization did not erase goods. It added services, software, intellectual property, finance, and standards to the frontier. Manufacturing indices that peak and then soften while services and IP climb are the signature of that shift. A modern country atlas must therefore track both containers and code. An economy that only reports tonnage will misread its own power—and its own vulnerability.
Export fingerprints
Germany and Japan can look similar through machines and vehicles, while Brazil and Saudi Arabia show very different resource and food signatures. The fingerprint is the mix across machines, vehicles, chemicals, resources, food, and services—not a single headline product. The question is not only what a place sells. It is what would break if the world stopped buying it, and what prestige categories would remain even if volume fell.
Dependency questions
The atlas ends with vulnerability questions: what does the country sell, who buys it, what inputs does it need, what could replace it, what carries prestige, and what is vulnerable? Those six prompts turn trade tables into identity analysis. Countries that cannot answer them with data are flying blind about their own external face. Countries that answer only with slogans are doing public relations, not strategy.
What to take away
Exports are identity under constraint. They show what a country can do at scale, what the world believes it is good for, and where substitution would hurt.
Later comparison work can rank places by complexity, concentration, cultural export power, and substitutability—but only after the fingerprint and the six diagnostic questions are in view.
■ END
The Fine PrintBack of the BoxEnd Credits
NoteWarningsDisclaimer
Artometrics data brief. Figures come from the sources below. Derived shares and editorial indices are not audited financials.
SourcesContentsSources
- SourceData note (no linked source on the original page): The source stack includes the OEC API, UN Comtrade, World Bank WDI, OECD, IMF, and national statistics offices. OEC is useful for complexity-minded views of what countries can make and s…
- ReportFull report: artometrics.com/atlas
MethodAssemblyMethod
Numbers in this issue are the published figures. The skin changes type, rules, and chart color only.
PlatesMade byImage credits
- HeroArtometrics Exports illustration.
- PlatePortrait of Luca Pacioli, attributed to Jacopo de' Barbari, c. 1495. Public domain, via Wikimedia Commons.
- PlateColor print of a toy shop, Utagawa Sadahide, 1860. The Metropolitan Museum of Art, CC0, via Wikimedia Commons.
- PlateBelasco Theatre box office, published November 1907 in Architects' and Builders' Magazine. Unknown photographer. Public domain, via Wikimedia Commons.


Updated through JUL 1, 2026.