



JUN 15, 2026 · Bikeshare
Bikeshare
How Far Portland Rides Actually Go
Trip-level bike-share data measures typical distance and duration across Biketown journeys.
By Kyle McAuliffe · · 4 min
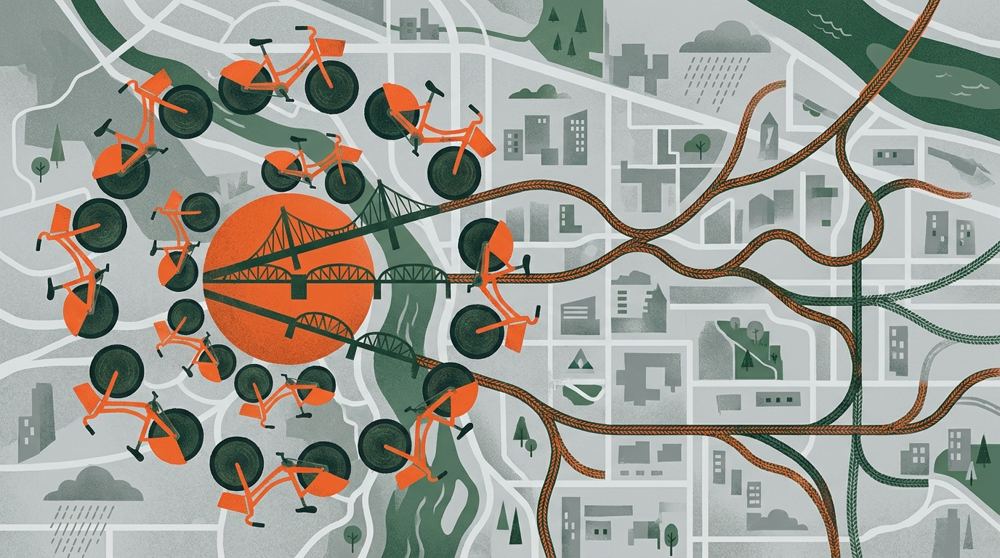
Portland’s Biketown system turns everyday movement into timestamped trips. The TidyTuesday extract used here holds 100,000 ride records spanning 2016–2018, with a median duration of 14.5 minutes and a recorded high of 1,392 minutes — multi-hour outliers that sit far from the commute core.
Recreation is the most common trip type in the file. That single label already hints at the system’s dual life: tourist and leisure loops on one side, workday hops on the other. Duration is the metric that organizes the charts.
100,000
Records in the working dataset
14.5
Median Duration min
1,392
Highest observed Duration min
Median Trip Length Fell Across Three Seasons
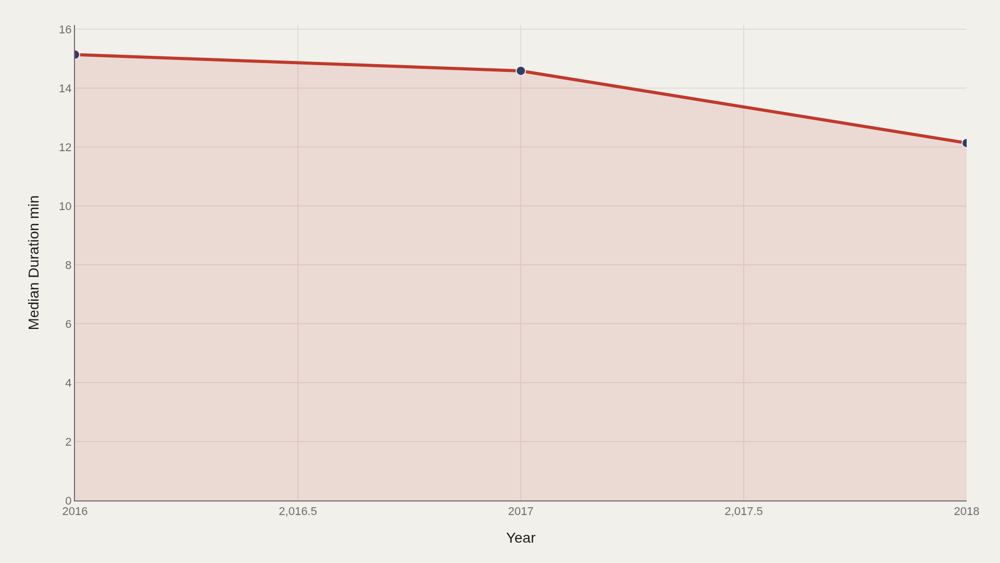
Median duration slips from about 15.1 minutes in 2016 to 14.6 in 2017 and 12.1 in 2018. The system’s typical ride got shorter even as the archive grew. That decline can reflect denser hub coverage, more habitual short hops, or a changing mix of recreation versus commute. The trend line alone cannot pick the cause — but it establishes that “a Biketown ride” was not a fixed product over these years.
Pop-Up and Waterfront Hubs Stretch Ride Time
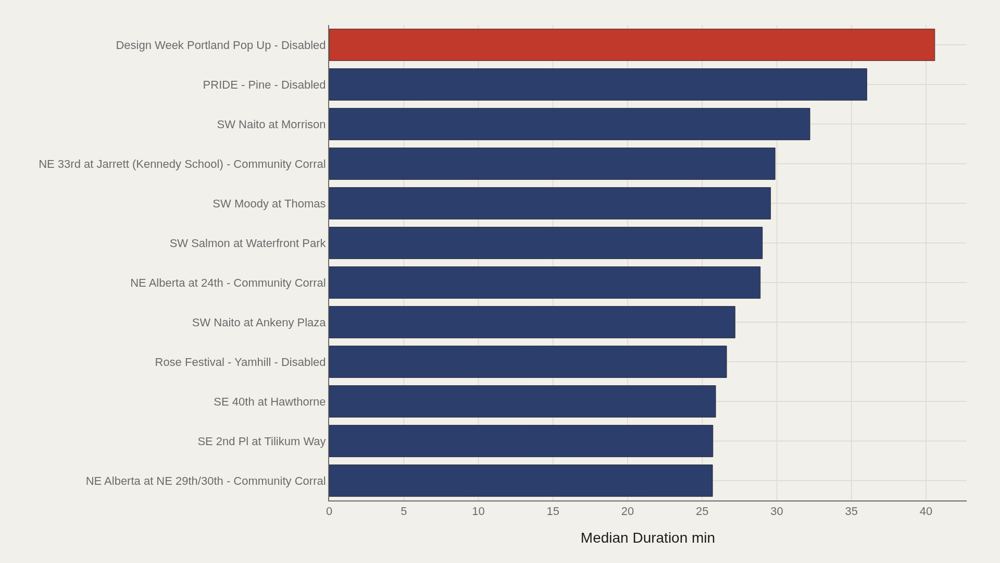
Design Week Portland Pop Up - Disabled leads median duration at about 40.6 minutes. PRIDE - Pine - Disabled follows near 36.0, with waterfront and event-adjacent hubs such as SW Naito at Morrison also running long. The median among the top dozen hubs is about 29.0 minutes — double the system-wide median of 14.5. Event and scenic starts systematically produce longer rides than the everyday grid.
Recreation Lasts Longer Than Work Trips
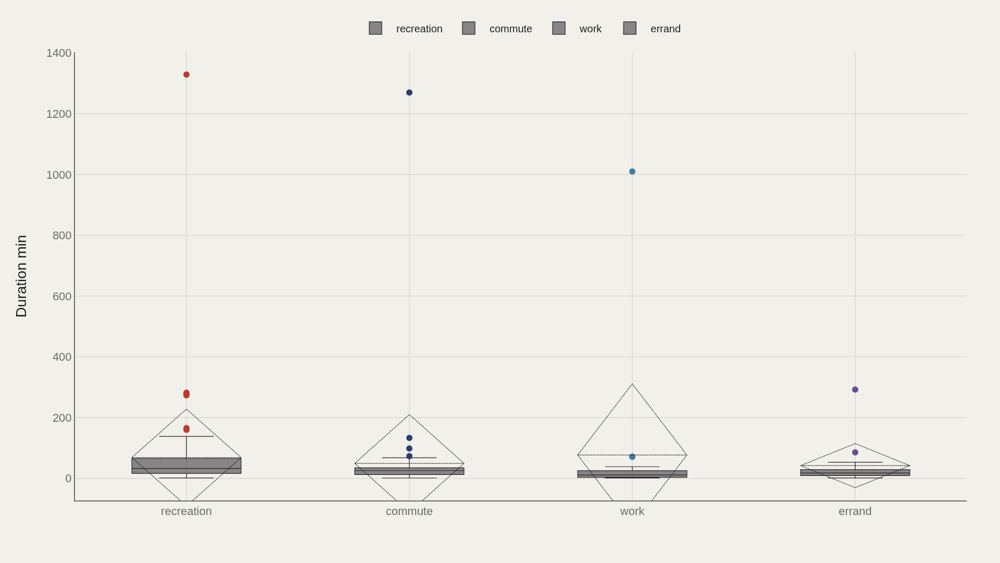
By trip type, recreation shows a median duration near 32.6 minutes (n=73 in the boxed sample), versus about 25.6 for commute, 17.7 for errand, and 11.4 for work. The boxes also expose extreme outliers above 1,000 minutes in recreation, commute, and work — dock failures, forgotten returns, or data quirks. The medians remain the honest center of each category.
Recreation Sits Furthest Above the System Median
Relative to the overall duration median, recreation leads the gap chart at roughly +18 minutes, with commute about +11 and errand slightly positive. Work sits below the median by about 3 minutes. That ordering matches the city’s split personality on two wheels: leisure explores; work punches a short path.
Longer Minutes Do Not Always Mean More Miles
Duration versus distance, colored by trip type, shows recreation spanning both long loopy rides and short spins. Commute points tighten toward moderate distances; work and errand clouds are smaller and closer to the origin. A 40-minute recreation ride may cover only a few miles along the waterfront. Minutes measure time in possession of the bike; miles measure geography. Biketown’s archive needs both.
What to take away
Biketown’s typical ride is short — a 14.5-minute median — and got shorter from 2016 to 2018. Recreation and event hubs pull the upper tail; work trips pull toward brevity.
The system is not one behavior. It is a leisure network and a commuting tool sharing the same docks, and duration is where that split becomes measurable.
■ END
The Fine PrintBack of the BoxEnd Credits
NoteWarningsDisclaimer
Artometrics data brief. Figures come from the sources below. Derived shares and editorial indices are not audited financials.
SourcesContentsSources
MethodAssemblyMethod
Numbers in this issue are the published figures. The skin changes type, rules, and chart color only.
PlatesMade byImage credits
- HeroArtometrics Bikeshare illustration.
- PlatePortrait of Luca Pacioli, attributed to Jacopo de' Barbari, c. 1495. Public domain, via Wikimedia Commons.
- PlateColor print of a toy shop, Utagawa Sadahide, 1860. The Metropolitan Museum of Art, CC0, via Wikimedia Commons.
- PlateBelasco Theatre box office, published November 1907 in Architects' and Builders' Magazine. Unknown photographer. Public domain, via Wikimedia Commons.


Updated through JUN 15, 2026.