



JUL 1, 2026 · Cities
Cities
A Data Framework for Economic Identity
1,667 subnational regions and 1,100+ datasets define the economic signature of cities — exports, housing, transit, culture, and historical infrastructure.
By Kyle McAuliffe · · 3 min

1,667 subnational regions in DOSE v2.14 and 1,100+ datasets in DataSF establish a system map for cities—what they export, import, price out, and preserve through infrastructure. This framework separates economic identity from promotional narrative with six diagnostic questions and eight system layers drawn from BEA regional GDP, DOSE global subnational output, World Cities Culture Forum, Census ACS, and local Socrata portals. The approach treats cities as layered machines—firms, ports, universities, housing, cultural venues, finance, infrastructure, rules, and stories—before any city-to-city comparison.
1,667
Subnational regions in DOSE v2.14 provide global coverage for cross-city economic comparison
45
Cities in World Cities Culture Forum 5th edition enable cultural infrastructure benchmarking
1,100+
Datasets in DataSF public portal supply granular local system data
System Layers
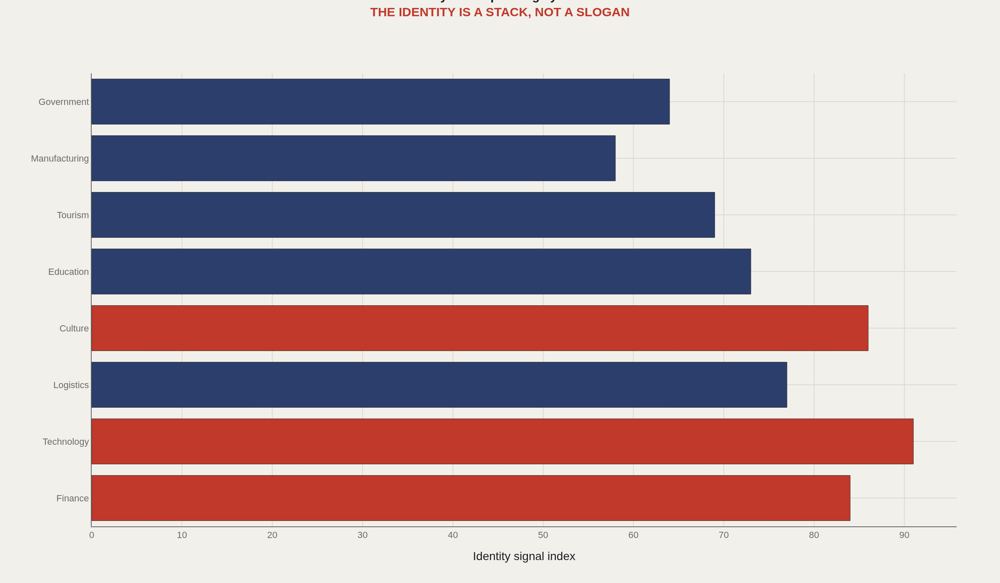
A city is not one industry. It is a layered machine: firms, ports, universities, housing, cultural venues, finance, infrastructure, rules, and stories. The first question is not whether a city is good. It is what kind of system the city is trying to be.
Goods and Services
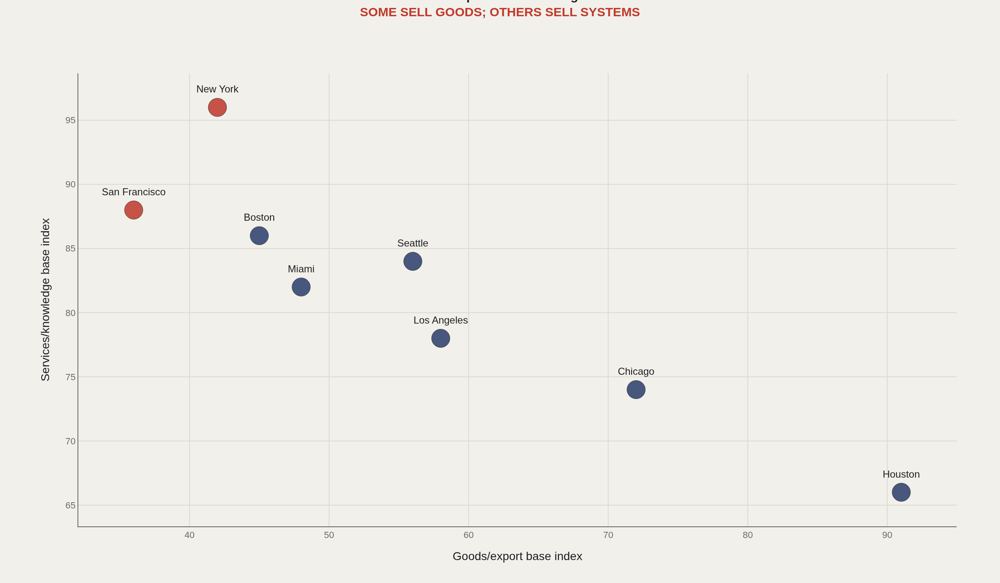
Houston and Los Angeles still have obvious goods and logistics signatures. New York and San Francisco sell more invisible products: finance, software, expertise, media, and market access. Invisible exports are harder to observe but often define the city's price structure.
History Layers
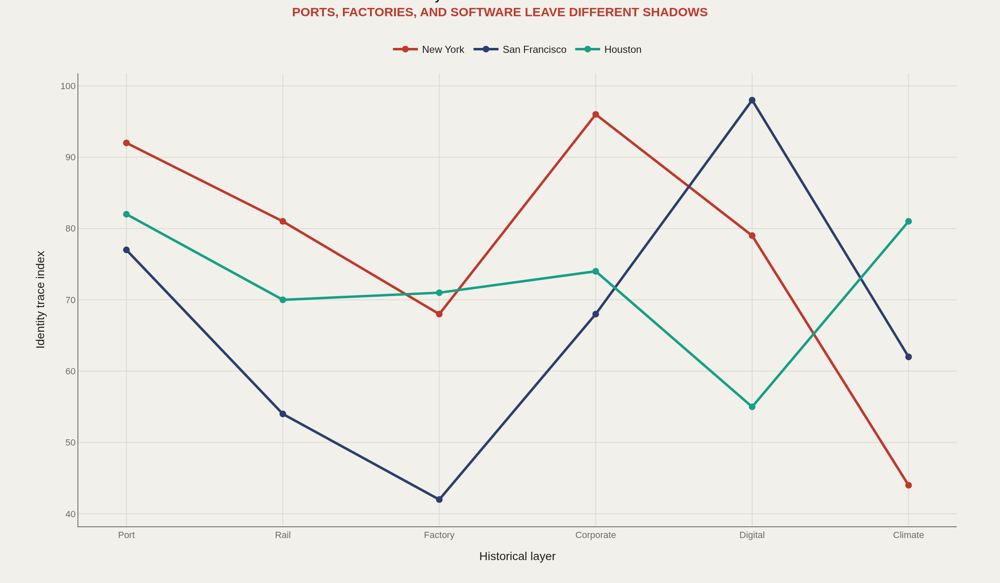
History is infrastructure that keeps generating data: street grids, warehouses, universities, firm clusters, zoning, and migration patterns. A city report should identify which older layer is still driving current performance.
City Fingerprint
One variable lies. A fingerprint requires a pattern. The same GDP level can mean very different things under different housing, transit, culture, and export structures. A city profile should read like a data portrait, not a fact sheet.
Questions
Before building comparisons, the local report needs its diagnostic questions. What does the place make? What does it import? What is scarce? Which cities are its real competitors? Those questions turn open data into an identity argument.
What to take away
Cities generate data signatures. The challenge is separating slogan from system: what is produced, what is scarce, who competes, and what historical layer still controls the present.
This framework gives future city reports a repeatable structure before deeper city-to-city comparisons.
■ END
The Fine PrintBack of the BoxEnd Credits
NoteWarningsDisclaimer
Artometrics data brief. Figures come from the sources below. Derived shares and editorial indices are not audited financials.
SourcesContentsSources
- SourceBEA. Regional GDP by county and metropolitan area documentation/API.
- SourceDOSE / PIK. Global subnational economic output dataset.
- SourceWorld Cities Culture Forum. CREATIVE Data Framework and 5th Edition Data Explorer.
- SourceDataSF and NYC Open Data. Socrata/SODA portal documentation.
- SourceU.S. Census ACS and International Trade Administration Metropolitan Export Series.
- ReportFull report: artometrics.com/bioeconomics
MethodAssemblyMethod
Numbers in this issue are the published figures. The skin changes type, rules, and chart color only.
PlatesMade byImage credits
- HeroArtometrics Cities illustration.
- PlatePortrait of Luca Pacioli, attributed to Jacopo de' Barbari, c. 1495. Public domain, via Wikimedia Commons.
- PlateColor print of a toy shop, Utagawa Sadahide, 1860. The Metropolitan Museum of Art, CC0, via Wikimedia Commons.
- PlateBelasco Theatre box office, published November 1907 in Architects' and Builders' Magazine. Unknown photographer. Public domain, via Wikimedia Commons.


Updated through JUL 1, 2026.