



APR 18, 2026 · Caesar
Caesar
Power at 0.95, Then the Ides
Caesar's LTA profile shows 0.95 Need for Power and 0.31 Distrust — he built an empire on magnanimity and died when three pardoned senators proved the theory wrong.
By Kyle McAuliffe · · 5 min
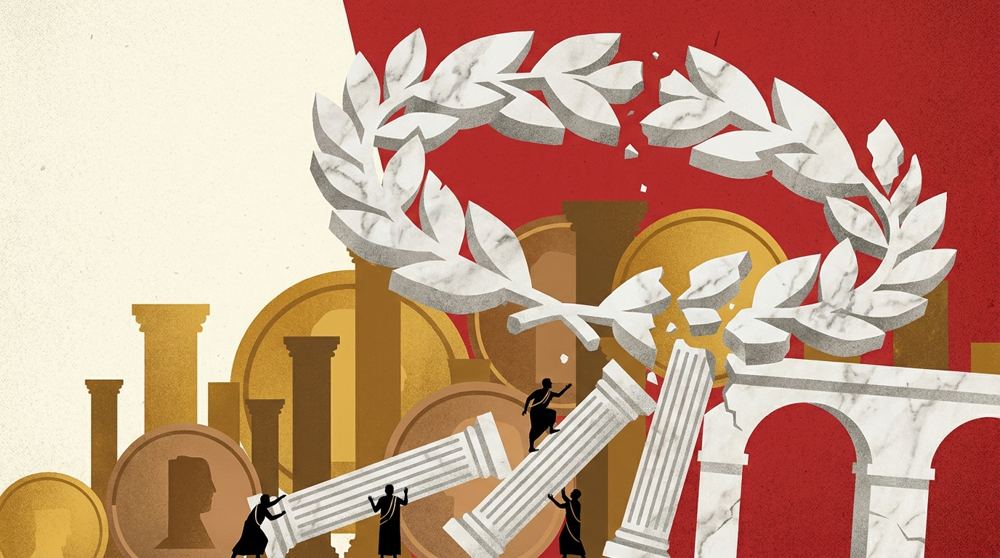
Julius Caesar scored 0.95 on Need for Power and 0.31 on Distrust under Leadership Trait Analysis — near-ceiling confidence in his right to rule, pathologically low suspicion of betrayal. He resettled 80,000 veterans, reformed Roman debt law, and stabilized grain supply in five years. Rome's GDP per capita rose 30% in the two centuries after his death, built on his reforms. He was stabbed 23 times by men he had pardoned and promoted. The house he built lasted five centuries because Augustus redesigned it to survive without him.
0.95
Caesar's Need for Power score under Hermann (1999) Leadership Trait Analysis, near the ceiling of any profiled world leader
0.31
Caesar's Distrust score, dramatically below the 0.48 average for world leaders, the structural vulnerability that explains March 15, 44 BCE
80,000
Veterans and urban poor resettled in land colonies during Caesar's dictatorship, addressing structural inequality while building his client base
Leadership Trait Analysis
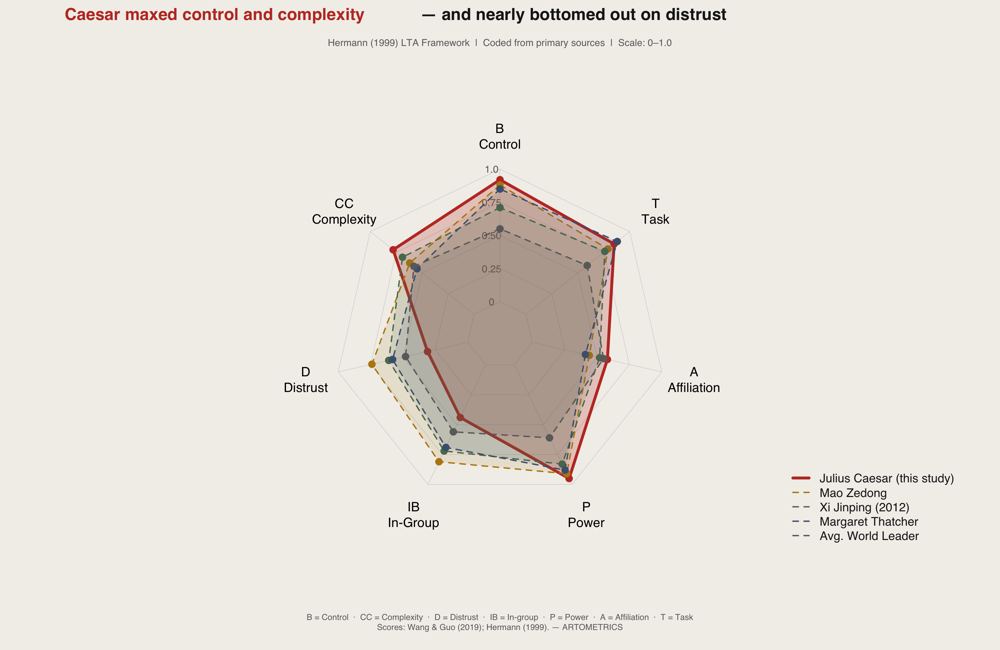
Caesar's LTA profile has a distinctive asymmetric shape. Two variables spike toward the outer ring — Need for Power (P = 0.95) and Belief in Ability to Control Events (B = 0.92). One variable collapses toward the center — Distrust of Others (D = 0.31). That triangle is the architecture of his career. He believed, with near-total conviction, that he could personally determine outcomes and that he should be the one doing so. He also extended trust readily and withdrew it slowly. The combination works at every scale — until the people you trust decide the same values you embody apply to removing you. Caesar exceeds the average world leader baseline on every variable except Distrust, where he falls dramatically below (0.31 vs. 0.48). He was not an extreme version of a normal leader. He was normal in every domain except pathologically low distrust and pathologically high power-need running simultaneously. Mao's comparison is instructive: Mao scores 0.74 on Distrust and 0.81 on In-Group Bias — the variables that explain the Cultural Revolution. Both scored near-ceiling on Need for Power. Mao purged. Caesar pardoned. Mao's successors dismantled his cult. Caesar's built an empire on his name. The single most important number on this chart is D = 0.31. A leader who extends trust this freely, at this level of power concentration, builds a system with no redundancy. Every node that fails hits the center directly.
The Economic Fingerprint
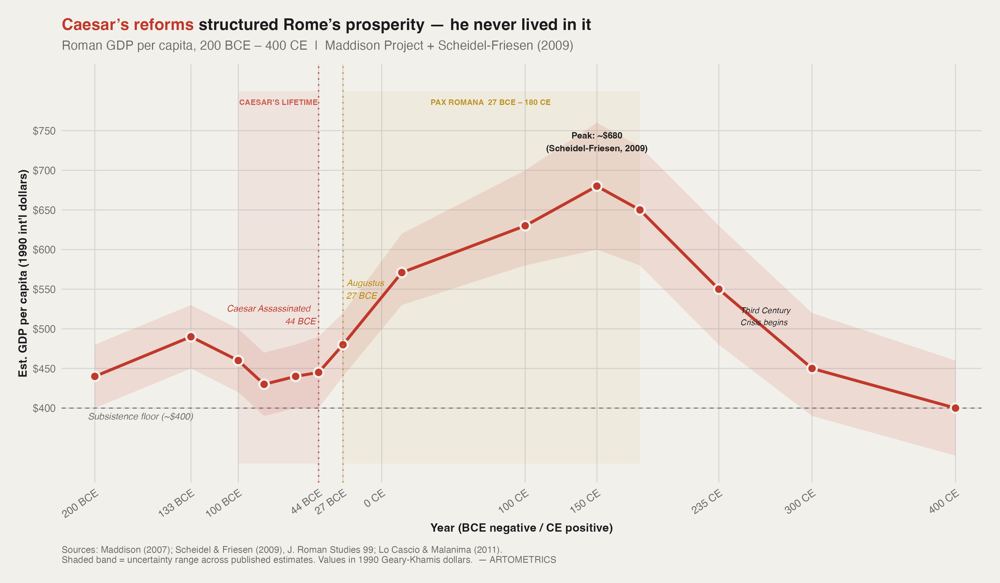
The most important feature is what comes after Caesar. Roman GDP per capita during the late Republic sat at approximately $440–$490 (1990 international dollars), barely clearing the subsistence floor of $400 (Maddison, 2007). The Scheidel-Friesen (2009) income distribution model places the top 1.5% capturing roughly 20% of all income. Grain supply chains failed regularly. Debt bondage was common. The Republic's fiscal machinery was captured by the factions fighting civil wars for control of it. Caesar's dictatorship lasted less than five years (49–44 BCE). His reforms held after his death, but GDP data shows no immediate uplift. The economy barely moves during his lifetime. It moves under Augustus, who took Caesar's policies and embedded them in institutions designed to outlive any individual: the principate, the imperial cult, the professional army with fixed terms and state pensions. From Augustus's consolidation (27 BCE) to Trajan (100 CE), Roman GDP per capita rose roughly 30% — from ~$480 to ~$630. The Scheidel-Friesen peak of ~$680 at 150 CE came 194 years after Caesar's assassination. This is the psychonomic paradox the chart makes numerical. Caesar's theory was that the self could substitute for institutional architecture — that personal authority, sufficiently magnanimous and forceful, was durable enough to hold the gains. Augustus understood what Caesar did not. He built the house so no single soul was load-bearing. Caesar authored the prosperity line. Augustus inhabited it. The distance between the assassination marker and the GDP peak measures the difference between their theories of power.
■ END
The Fine PrintBack of the BoxEnd Credits
NoteWarningsDisclaimer
Artometrics data brief. Figures come from the sources below. Derived shares and editorial indices are not audited financials.
SourcesContentsSources
- SourceBolt, J., & van Zanden, J.L. (2020). Maddison Project Database, version 2020. University of Groningen.
- SourceCaesar, J. (58–50 BCE). Commentarii de Bello Gallico. Trans. W.A. McDevitte & W.S. Bohn. Project Gutenberg.
- SourceCicero, M.T. (46 BCE). Brutus.
- SourceDyson, S.B. (2006). Personality and foreign policy: Tony Blair's Iraq decisions. Foreign Policy Analysis, 2(3), 289–306.
- SourceGoldsworthy, A. (2006). Caesar: Life of a Colossus. Yale University Press.
- SourceHermann, M.G. (1999). Assessing Leadership Style: A Trait Analysis. Social Science Automation.
- SourceLo Cascio, E., & Malanima, P. (2011). Ancient and pre-modern economies: GDP in the Roman Empire and early modern Europe. Paper presented at the Conference on Quantifying Long Run Economic Development, Venice, March 22–24.
- SourceMaddison, A. (2007). Contours of the World Economy 1–2030 AD. Oxford University Press.
- SourceMilanovic, B., Lindert, P.H., & Williamson, J.G. (2011). Pre-industrial inequality. The Economic Journal, 121(551), 255–272.
- SourcePliny the Elder. Naturalis Historia, 7.54.
- SourcePlutarch. (c. AD 100). Parallel Lives: Caesar. Trans. Robin Seager. Penelope/University of Chicago.
- SourcePost, J.M. (2004). Leaders and Their Followers in a Dangerous World. Cornell University Press.
- SourceScheidel, W., & Friesen, S.J. (2009). The size of the economy and the distribution of income in the Roman Empire. Journal of Roman Studies, 99, 61–91.
- SourceStrauss, B. (2015). The Death of Caesar: The Story of History's Most Famous Assassination. Simon & Schuster.
- SourceSuetonius. (c. AD 121). The Twelve Caesars: Divus Julius. Trans. Robert Graves. Penguin Classics.
- SourceWang, X., & Guo, Y. (2019). Leadership trait analysis of Chinese Communist leaders. Journal of Chinese Political Science, 24(3).
- ReportFull report: artometrics.com/caesar
MethodAssemblyMethod
Numbers in this issue are the published figures. The skin changes type, rules, and chart color only.
PlatesMade byImage credits
- HeroArtometrics Caesar illustration.
- PlatePortrait of Luca Pacioli, attributed to Jacopo de' Barbari, c. 1495. Public domain, via Wikimedia Commons.
- PlateColor print of a toy shop, Utagawa Sadahide, 1860. The Metropolitan Museum of Art, CC0, via Wikimedia Commons.
- PlateBelasco Theatre box office, published November 1907 in Architects' and Builders' Magazine. Unknown photographer. Public domain, via Wikimedia Commons.


Updated through APR 18, 2026.