



JUN 15, 2026 · CEOs
CEOs
CEO Tenure Caps at 2.5 Years in 9,423 Departure Records
Median tenure coded at 1.0 year; "Interim" label accounts for 218 observations in TidyTuesday departures extract.
By Kyle McAuliffe · · 3 min

In 9,423 TidyTuesday CEO-departure records, median max tenure ceodb is 1.00 year and the ceiling is 4.00. "Interim" appears in 218 rows—the dominant succession label—while company-level leaders reach 2.0–2.5 years at most.
The median of 1.00 sets the baseline: many coded departure spells are short. The data ask which companies show longer max tenures, how interim versus co-CEO labels differ, and whether tenure fields move together.
9,423
Departure records with median max tenure of 1.00 year
2.50
Ceiling for company leaders (Stewart Information, Conversant Inc)
218
"Interim" label count, median tenure 1.0 year
Longer Max Tenures Are Rare in the Company Ranking
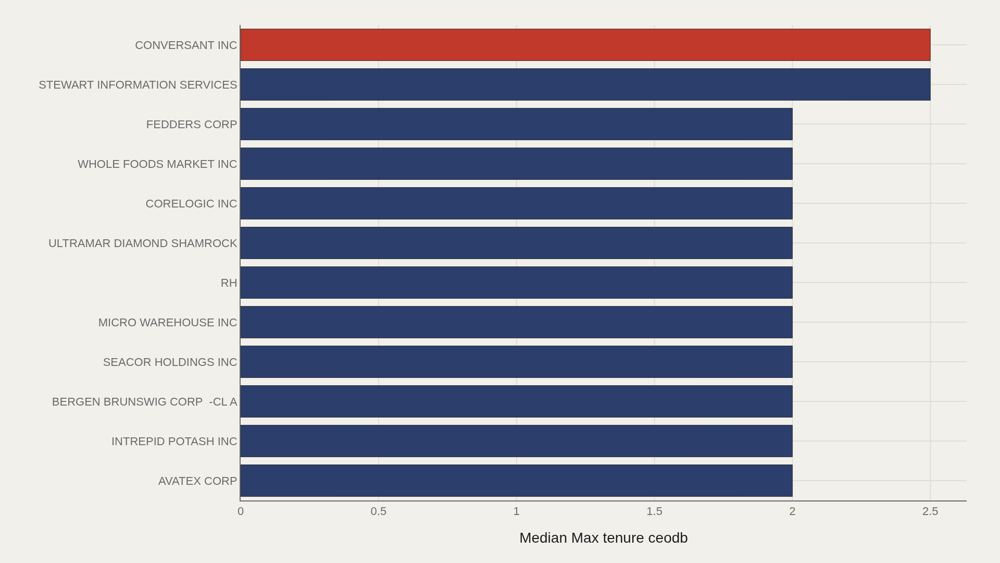
Stewart Information Services and Conversant Inc lead at 2.50 on max tenure ceodb. A second tier—Avatex, Intrepid Potash, Bergen Brunswig, SEACOR, Micro Warehouse, RH—clusters at 2.00. Relative to the file median of 1.00, even these leaders are only modestly longer spells. Extended CEO tenure is the exception, not the rule.
The Top Dozen Caps Out Quickly
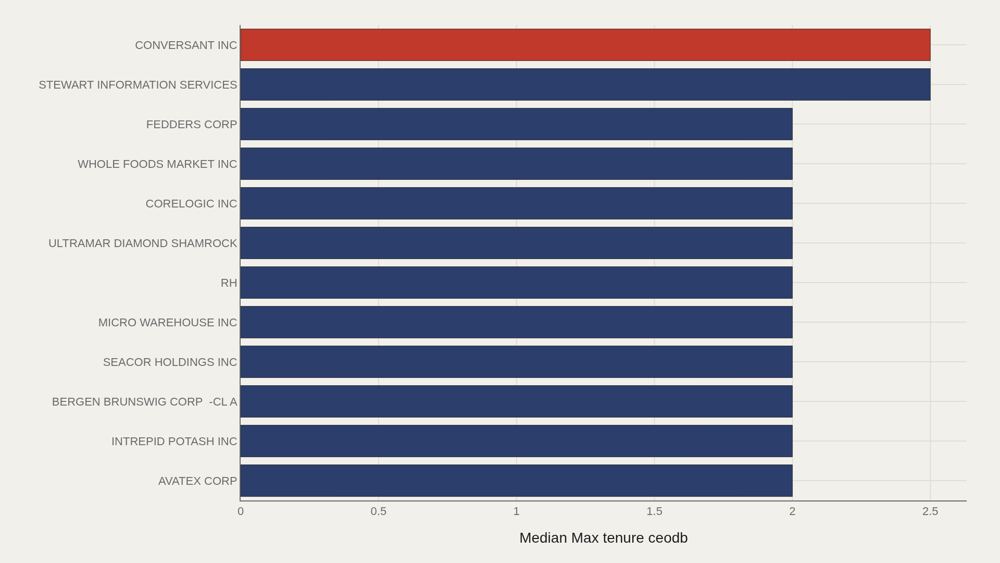
Conversant Inc appears at 2.50, and the median among the top dozen is 2.00. There is no long tail of decade-scale max tenures in this ranking metric. Cite 2.00 as the elite-club median for max tenure ceodb—double the overall median, still short of popular narratives about imperial CEOs.
Interim Labels Dominate the Category Mix
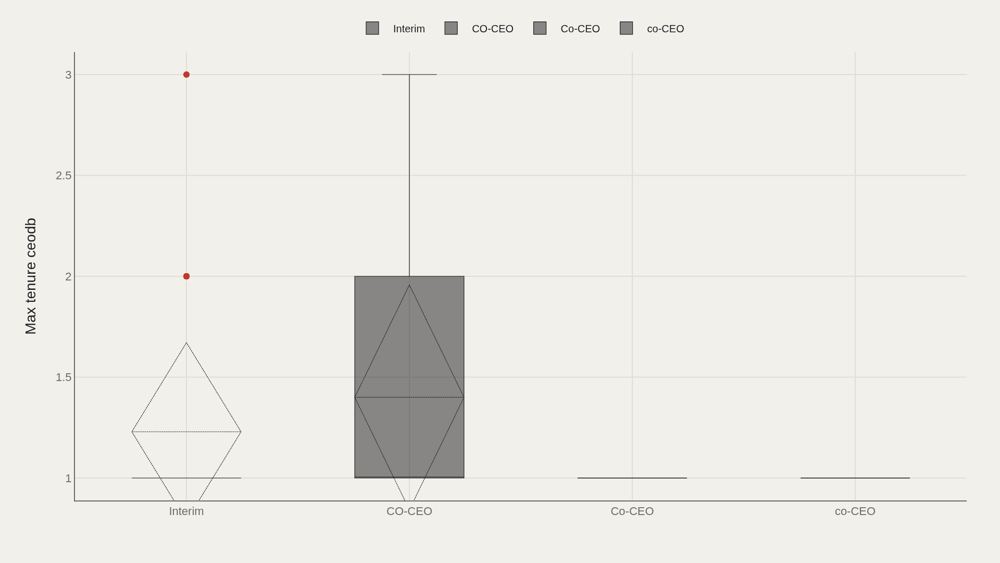
Interim accounts for 218 observations with a median max tenure of 1.0 and a mean near 1.23. CO-CEO shows 85 rows with the same median of 1.0 but a slightly higher mean of approximately 1.4. Smaller capitalization variants are tiny samples. The file is thick with interim spells—a succession-system fact: many departures pass through temporary authority before a permanent appointment.
Gaps to the Median Are Mostly Flat
Most interim/co-CEO labels sit at a zero gap to the median on max tenure ceodb, with only a thinly populated CO-ceo variant showing a positive gap of 1.0. Category labels do not produce a dramatic tenure hierarchy. The larger pattern is the volume of spells coded interim.
Tenure Fields Track Closely Within Labels
Max tenure ceodb versus tenure no ceodb, colored by interim/co-CEO label, largely follows a tight correspondence—points hug aligned values, especially in the interim cloud (n=218). Where the two tenure fields disagree, coding definitions matter more than boardroom narrative. The scatter is a consistency check on the file's tenure construction.
What to take away
In 9,423 departure records, max tenure ceodb centers at 1.00, with company-level leaders reaching only 2.0–2.5. Interim is the dominant succession label.
The institutional story: departure files are full of short and interim spells, not a catalog of decades-long reigns.
■ END
The Fine PrintBack of the BoxEnd Credits
NoteWarningsDisclaimer
Artometrics data brief. Figures come from the sources below. Derived shares and editorial indices are not audited financials.
SourcesContentsSources
MethodAssemblyMethod
Numbers in this issue are the published figures. The skin changes type, rules, and chart color only.
PlatesMade byImage credits
- HeroArtometrics CEOs illustration.
- PlatePortrait of Luca Pacioli, attributed to Jacopo de' Barbari, c. 1495. Public domain, via Wikimedia Commons.
- PlateColor print of a toy shop, Utagawa Sadahide, 1860. The Metropolitan Museum of Art, CC0, via Wikimedia Commons.
- PlateBelasco Theatre box office, published November 1907 in Architects' and Builders' Magazine. Unknown photographer. Public domain, via Wikimedia Commons.


Updated through JUN 15, 2026.