



JUN 15, 2026 · Whales
Whales
Captive Cetacean Transfers Peaked in 1972 at 170 U.S. Records
2,172 of 2,194 cetacean transfer records are US-labeled; bottlenose dolphins account for 1,668 entries in a 1946–2017 captivity ledger.
By Kyle McAuliffe · · 3 min
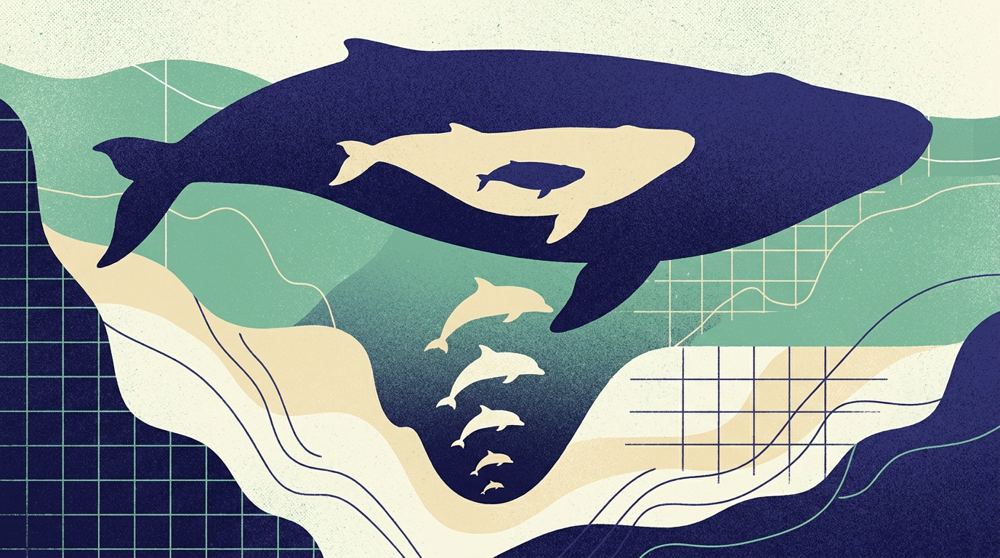
Captive cetacean transfer records from 1946–2017 concentrate overwhelmingly in US institutions: 2,172 of 2,194 entries carry a US label, and bottlenose dolphins account for 1,668 records—76% of the file. Annual volume peaked around 1972 at roughly 170 entries, then declined through the 2010s.
Every timeline and species comparison inherits this bottlenose bias. The archive is a US-centric captivity ledger, not a balanced global survey.
1,668
Bottlenose dolphins — 76% of all records, dwarfing orcas (79) and belugas (68)
2,172
US-labeled transfers — 99% of the dataset, versus 22 foreign entries
170
Peak year count in 1972 — transfers declined steadily after the late 1970s
Transfers Concentrate Overwhelmingly in the US
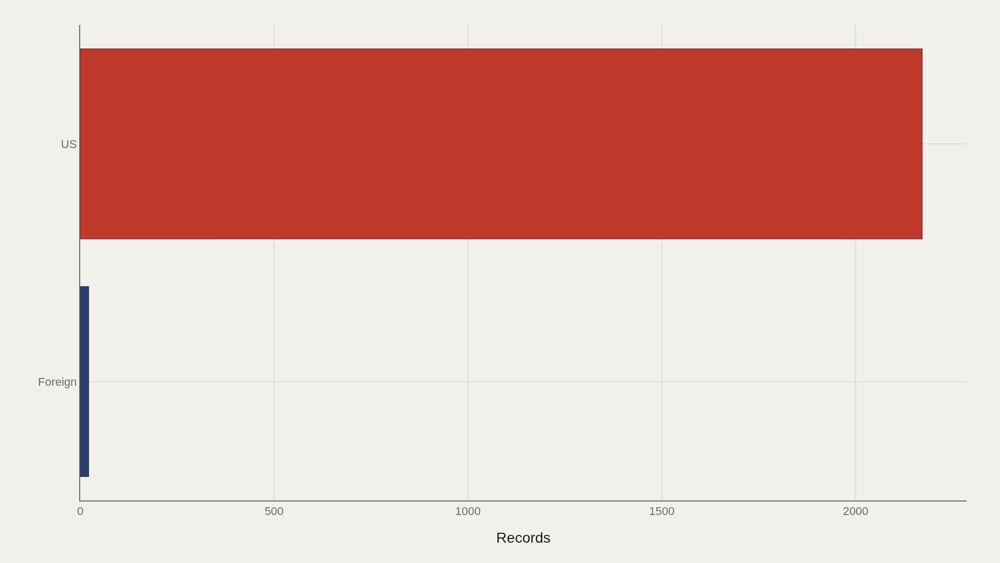
US-labeled transfers account for 2,172 records versus 22 marked Foreign. The geography of the file reflects US institutional reporting, not global captivity patterns. Any species comparison inherits that reporting bias. What looks like a biological pattern may be an artifact of institutional geography.
Annual Volume Peaked in the Early 1970s
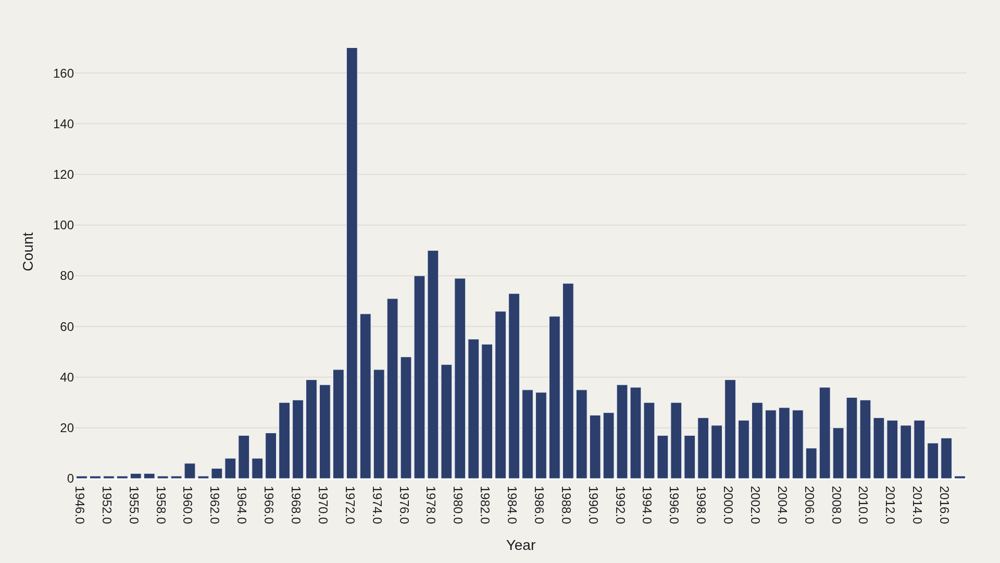
Record counts by year crest around 1972 at roughly 170 entries, with smaller peaks in the late 1970s and early 1980s: 90 in 1978, 80 in 1977, 79 in 1980. By the 2010s, annual counts decline to single digits. The volume timeline tracks institutional activity—when transfers were logged most densely, and when documentation thinned.
Bottlenose Is the Archive's Default Animal
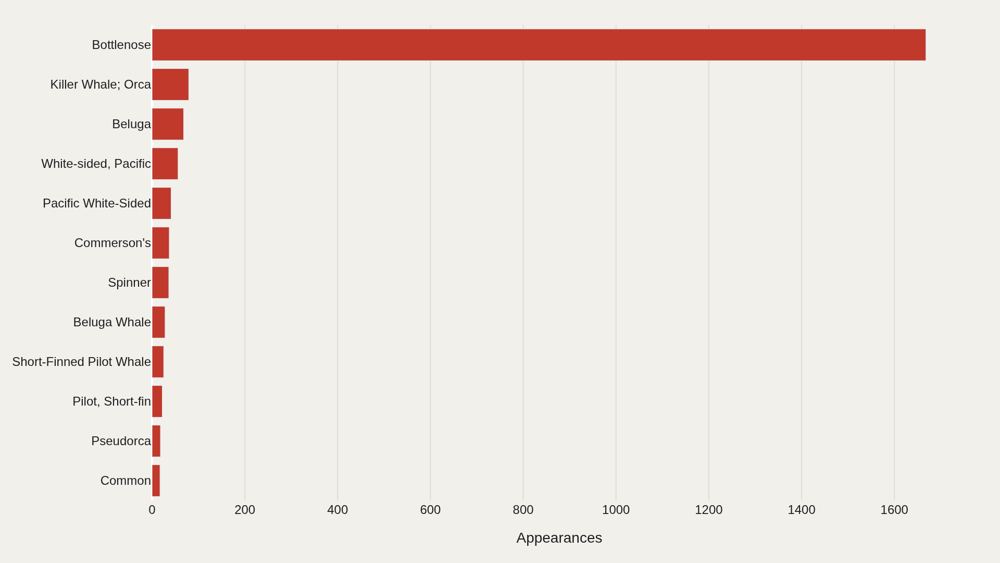
Bottlenose appears 1,668 times—an order of magnitude above Killer Whale/Orca (79), Beluga (68), and Pacific white-sided variants (combined labels in the several dozens). Without bottlenose, this would be a small file. With it, every other species is a minority subplot.
The US Bucket Is the Landscape
Restating the geography: US 2,172 versus Foreign 22. The category chart is almost a single bar. Claims about global captivity patterns cannot be read from this extract without external sources that rebalance non-US institutions.
Species Timelines Follow Different Eras
Bottlenose transfers spike with the early-1970s volume peak (about 144 in 1972). Orca records show smaller pulses across the late 1960s–1980s. Beluga counts rise in scattered later years. White-sided labels show activity in the 1970s–1980s. Different species enter the ledger on different clocks—bottlenose sets the tempo.
What to take away
Across 2,194 rows, the story is concentration twice over: US geography (2,172) and bottlenose identity (1,668).
Cite the 1972 volume peak when discussing historical intensity, and treat non-bottlenose species as sparse but distinct timelines inside a bottlenose-dominated ledger.
■ END
The Fine PrintBack of the BoxEnd Credits
NoteWarningsDisclaimer
Artometrics data brief. Figures come from the sources below. Derived shares and editorial indices are not audited financials.
SourcesContentsSources
MethodAssemblyMethod
Numbers in this issue are the published figures. The skin changes type, rules, and chart color only.
PlatesMade byImage credits
- HeroArtometrics Whales illustration.
- PlatePortrait of Luca Pacioli, attributed to Jacopo de' Barbari, c. 1495. Public domain, via Wikimedia Commons.
- PlateColor print of a toy shop, Utagawa Sadahide, 1860. The Metropolitan Museum of Art, CC0, via Wikimedia Commons.
- PlateBelasco Theatre box office, published November 1907 in Architects' and Builders' Magazine. Unknown photographer. Public domain, via Wikimedia Commons.


Updated through JUN 15, 2026.