



APR 14, 2026 · Coffee
Coffee
Ethiopia Scores Highest on Coffee Quality—With Zero Starbucks Stores
Ethiopia's median CQI cup score is 85.3 — the highest of 16 countries with 20+ samples — yet Starbucks operates zero stores in the top three scoring nations.
By Kyle McAuliffe · · 5 min
Ethiopia's median Coffee Quality Institute cup score is 85.3 — the highest of any country with 20 or more rated samples — yet Starbucks operates zero stores there. The same is true for Kenya and Uganda, the second- and third-highest scoring nations. Coffee's quality map and its retail map describe two unrelated geographies.
This analysis uses CQI cupping scores and Starbucks store counts to test whether sensory quality and branded retail power accumulate in the same places. They do not. The countries that grow the best-rated coffee capture little of the value that branded retail extracts downstream.
85.3
Ethiopia's median CQI cup score — highest of any country with 20+ samples, leading on every sensory sub-metric
0
Starbucks locations in Ethiopia, Kenya, and Uganda — the top three scoring origins show zero branded retail presence
1,339
Coffee samples rated by CQI Q Graders across Arabica and Robusta species in the TidyTuesday dataset
Where Great Coffee Comes From
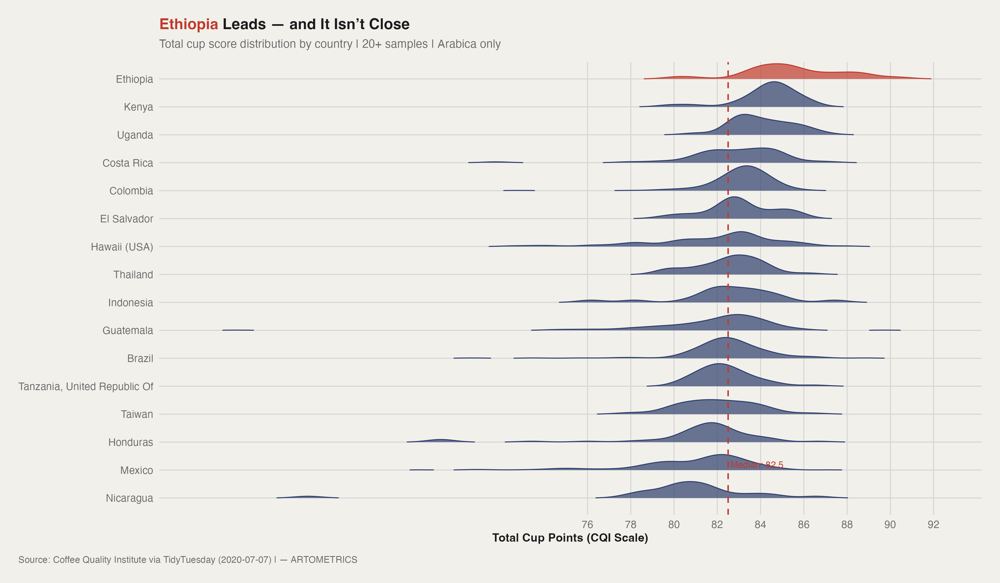
Ethiopia occupies a different part of the distribution entirely. The median cup score across all 16 qualifying countries is 82.5. Ethiopia's distribution peaks near 85 and has a long right tail that no other origin approaches. Kenya and Uganda sit in second and third, but their distributions overlap substantially with the rest of the field. Ethiopia's does not. Ethiopia is the genetic origin of Arabica coffee — the Kaffa region in southwestern Ethiopia is where the species was first documented growing wild. The country's range of elevation, soil diversity, and processing tradition produces a flavor complexity that Q Graders reward with above-median scores across every sub-metric. The bottom of the chart is equally clear. Nicaragua, Mexico, Honduras, and Taiwan cluster between 81 and 83 — technically specialty grade, but at the floor. Brazil, the world's largest coffee producer by volume, lands in the lower half — market dominance and cup quality are not the same thing.
The Quality-Retail Disconnect
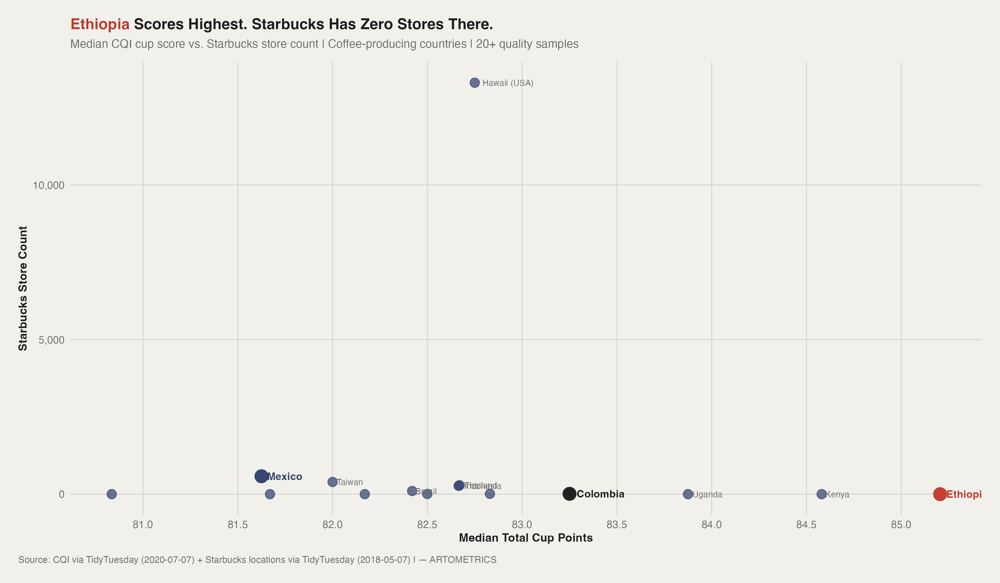
There is no positive relationship between a country's quality score and Starbucks' retail presence there. The three highest-scoring origins — Ethiopia, Kenya, and Uganda — all sit at zero Starbucks locations. Hawaii (USA) lands near the top of the y-axis not because of its quality rank but because its ISO code maps to the US, which hosts thousands of Starbucks locations. This is structural. Starbucks builds stores in markets where it can sell coffee, not only in markets where it sources coffee. Ethiopia's retail consumer market is too small and too low-income to support the Starbucks price point at scale. The company sources Ethiopian beans, but that sourcing relationship does not translate into a domestic retail presence. Colombia reinforces the pattern: a recognized origin with specialty scores that shows little Starbucks store footprint relative to the fame of its beans. Economic value from growing specialty coffee does not automatically accumulate where the coffee is grown.
The Sub-Metric Fingerprint
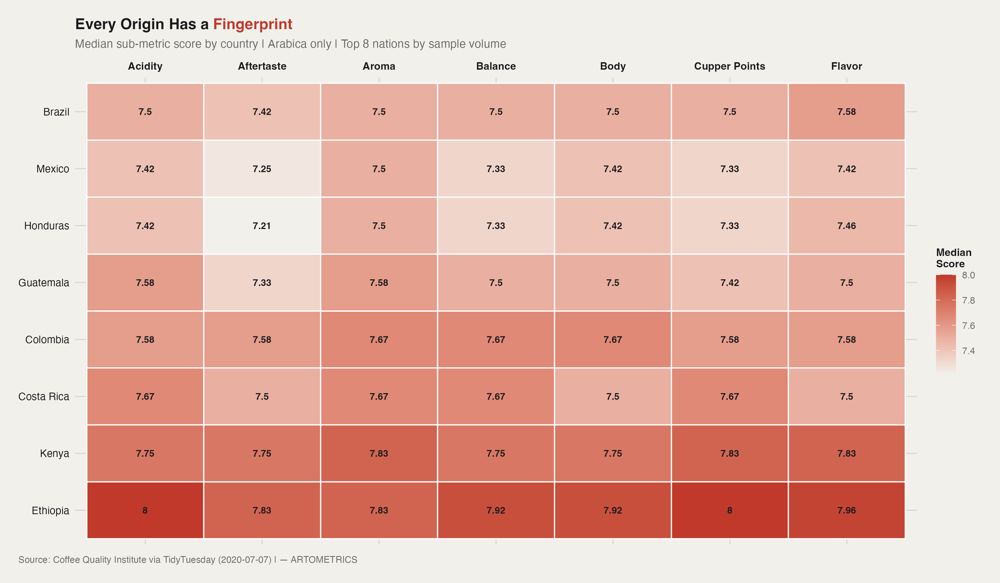
Ethiopia scores higher on every single sub-metric among the eight-country heatmap field. Its median acidity, cupper points, and flavor lead the set. Kenya comes close on aroma and flavor but trails on most other dimensions. The heatmap also reveals how flat the remaining countries are. Brazil sits in a narrow mid band across attributes — consistent and undifferentiated. Honduras and Mexico are nearly indistinguishable on several scores. When buyers talk about commodity coffee, this is the sensory data behind the phrase. Guatemala and Colombia show elevated acidity and balance relative to that flat middle — profiles that translate easily into consumer language about brightness and approachability.
What to take away
Quality and market power are not the same thing, and they do not flow in the same direction. Ethiopia produces the highest-rated coffee in this CQI slice by a significant margin and shows zero Starbucks locations in the joined retail file.
Brazil dominates volume while scoring in the lower half of this quality ranking. The countries that grow the best-scoring coffee are not automatically the countries that capture the most retail value from coffee's global brand.
■ END
The Fine PrintBack of the BoxEnd Credits
NoteWarningsDisclaimer
Artometrics data brief. Figures come from the sources below. Derived shares and editorial indices are not audited financials.
SourcesContentsSources
- SourceThe Coffee Quality Institute data should be read as a specialty-coffee evaluation archive, not a random sample of all coffee output. CQI Q Graders score submitted samples under standardized protocols, which means the file is strongest fo…
- SourceThe broader citation frame comes from coffee-development and value-chain research by Daviron, Ponte, Samper, Quiñones-Ruiz, and the International Coffee Organization. Those sources matter because the charts show a classic commodity-chain…
- SourceTidyTuesday (2020-07-07). Coffee Ratings. R for Data Science Community. github.com/rfordatascience/tidytuesday/…/2020-07-07
- SourceTidyTuesday (2018-05-07). Coffee Chains. R for Data Science Community. github.com/rfordatascience/tidytuesday/…/2018-05-07
- SourceCoffee Quality Institute. (2020). Q Grader Program and Cupping Protocols. Retrieved from coffeeinstitute.org
- SourceSamper, L. F., & Quiñones-Ruiz, X. F. (2017). Towards a balanced sustainability vision for the coffee industry. Resources, 6(2), 17. doi.org/10.3390/resources6020017
- SourceDaviron, B., & Ponte, S. (2005). The Coffee Paradox: Global Markets, Commodity Trade and the Elusive Promise of Development. Zed Books.
- SourceWintgens, J. N. (Ed.). (2009). Coffee: Growing, Processing, Sustainable Output (2nd ed.). Wiley-VCH.
- ReportFull report: artometrics.com/coffee
MethodAssemblyMethod
Numbers in this issue are the published figures. The skin changes type, rules, and chart color only.
PlatesMade byImage credits
- HeroArtometrics Coffee illustration.
- PlatePortrait of Luca Pacioli, attributed to Jacopo de' Barbari, c. 1495. Public domain, via Wikimedia Commons.
- PlateColor print of a toy shop, Utagawa Sadahide, 1860. The Metropolitan Museum of Art, CC0, via Wikimedia Commons.
- PlateBelasco Theatre box office, published November 1907 in Architects' and Builders' Magazine. Unknown photographer. Public domain, via Wikimedia Commons.


Updated through APR 14, 2026.