



JUN 15, 2026 · Emmys
Emmys
SNL's 859 Records Beat Every Show
Saturday Night Live appears 859 times across 29,678 Emmy records from 1957–2021—three times the next-closest show.
By Kyle McAuliffe · · 3 min

Saturday Night Live appears 859 times across 29,678 Emmy records from 1957–2021—three times more than the next-closest show and a sign that Emmy concentration tilts toward programs that return year after year rather than one-night sweeps.
The working file holds 29,678 records spanning 1957–2021. Nominee is the most common label, accounting for 23,739 rows—wins and other designations occupy a thinner slice, which means any leaderboard drawn from this extract ranks recurrence more than victory.
859
Saturday Night Live appearances across the dataset—three times more than the next show
2,613
Record count in 2019, the densest Emmy year from 1957–2021
23,739
Nominee entries out of 29,678 total rows—wins comprise a thin slice
Landscape
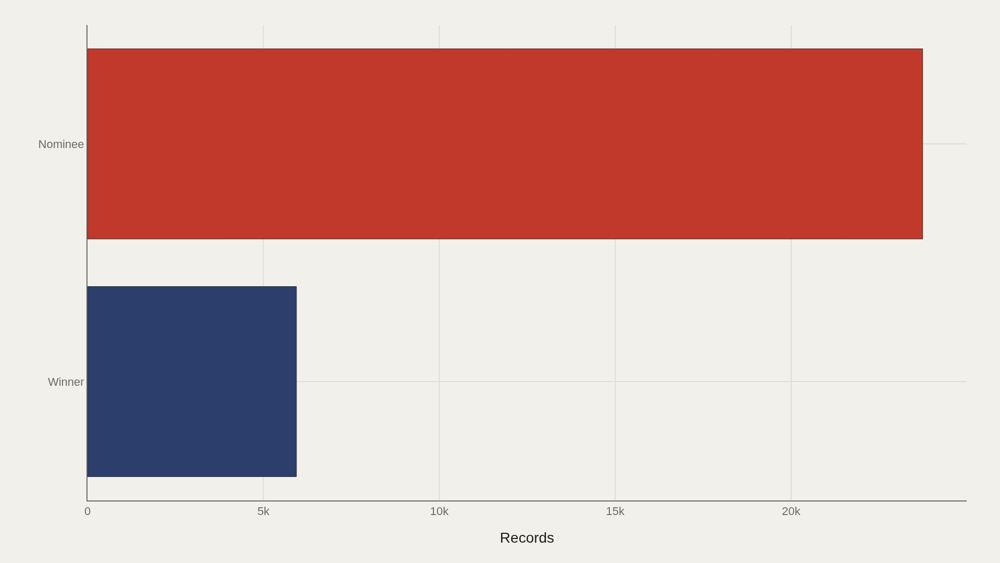
Nominee dominates with 23,739 records. The file is built around nomination rows; wins and other type labels sit in a thinner slice. That imbalance is structural—any leaderboard drawn from this extract ranks how often names enter the nominee column, not how often they win.
Volume
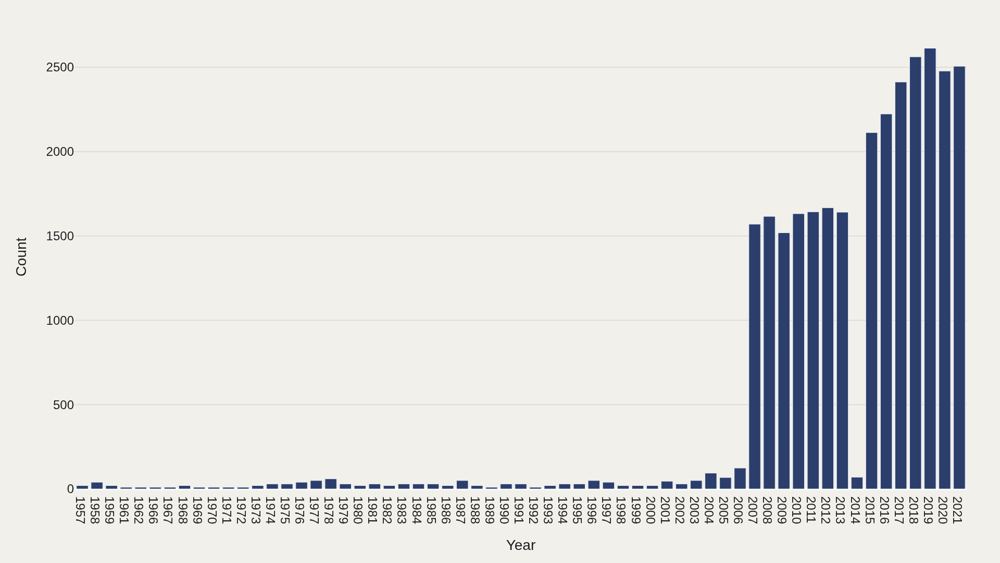
Activity peaks in 2019 with 2,613 records—the densest year in the span. Period-level counts show when Emmy paperwork thickened: more categories, more programs, more named credits. Volume is the first signal that awards seasons are not equally crowded across decades.
Who sits at the top
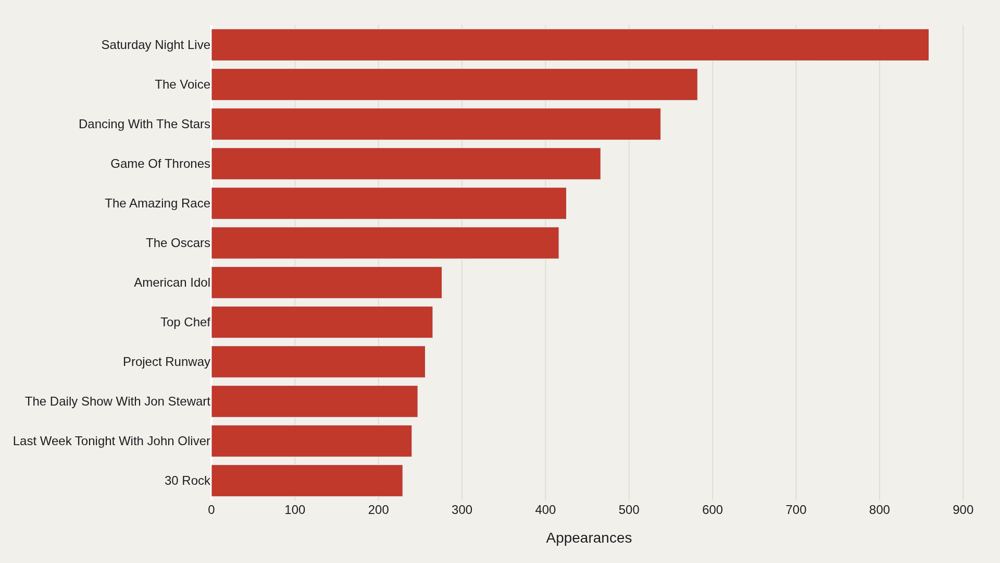
Saturday Night Live appears 859 times—the most recurring name in the file. The top dozen account for a visible share of all 29,678 rows. Long-running variety and franchise programs accumulate nominations the way long careers accumulate credits. Dominance here is recurrence, not a single sweep night.
Category
Nominee is the largest bucket with 23,739 records. Category concentration shows where editorial attention should focus when reading the table. If the question is "who swept," separate win rows carefully. If the question is "who kept getting invited," this nominee-heavy landscape is the right map.
Timeline
Leading names do not move in lockstep—some fade as others surge. Tracking counts over time separates sustained presence from one-off spikes. A show that dominates a single ceremony is a different data shape from a name that returns for decades.
What to take away
Emmy concentration shows up as recurrence: Saturday Night Live at 859 appearances, a nominee column that holds 23,739 of 29,678 rows, and a 2019 peak of 2,613 records. Leaders, volume, and timelines each answer a different question about how lopsided the season became.
Use the charts to separate invitation from victory—then check the type field before treating any name as a sweep.
■ END
The Fine PrintBack of the BoxEnd Credits
NoteWarningsDisclaimer
Artometrics data brief. Figures come from the sources below. Derived shares and editorial indices are not audited financials.
SourcesContentsSources
MethodAssemblyMethod
Numbers in this issue are the published figures. The skin changes type, rules, and chart color only.
PlatesMade byImage credits
- HeroArtometrics Emmys illustration.
- PlatePortrait of Luca Pacioli, attributed to Jacopo de' Barbari, c. 1495. Public domain, via Wikimedia Commons.
- PlateColor print of a toy shop, Utagawa Sadahide, 1860. The Metropolitan Museum of Art, CC0, via Wikimedia Commons.
- PlateBelasco Theatre box office, published November 1907 in Architects' and Builders' Magazine. Unknown photographer. Public domain, via Wikimedia Commons.


Updated through JUN 15, 2026.