



JUL 1, 2026 · Exports
Exports
Platforms, Factories, and Machines
The U.S., China, and Germany dominate trade through different architectures — platform control, manufacturing scale, and industrial precision.
By Kyle McAuliffe · · 5 min
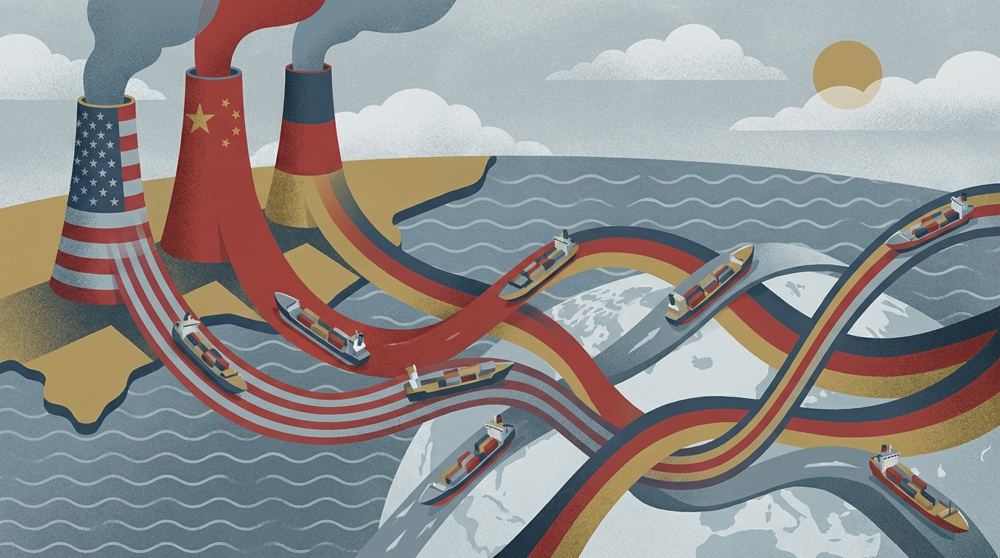
The United States controls platforms and standards. China anchors global manufacturing supply chains. Germany produces precision machinery that takes years to certify and replace. When policy writers call these three countries "export superpowers," they collapse three different systems into one headline.
3
Export systems compared — platform power (U.S.), factory scale (China), machinery trust (Germany)
7
Identity axes measured — services, IP, manufacturing, vehicles, platforms, supply chains, complexity
6
Dependency risks scored — semiconductors, energy, consumer demand, labor, allies, shipping lanes
Three models of export power
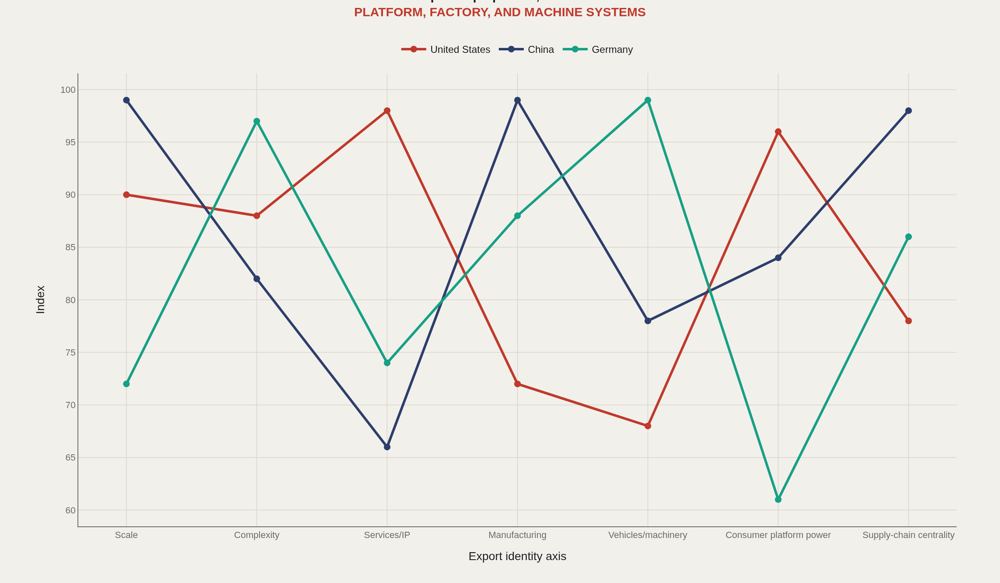
On seven identity axes — scale, complexity, services and IP, manufacturing, vehicles and machinery, consumer platform power, and supply-chain centrality — each economy peaks in a different place. The United States scores highest on services, intellectual property, and consumer platform power. China leads on manufacturing scale and supply-chain centrality. Germany concentrates strength in complex machinery, vehicles, and industrial trust. Treating them as rivals in a single market misreads the architecture. U.S. export power runs through firms and standards ecosystems: Apple, Microsoft, NVIDIA, Boeing, Hollywood studios, universities, and dollar-denominated finance. China's power runs through manufacturing provinces, port infrastructure, electronics assembly, solar panels, batteries, and supplier networks documented in UN Comtrade and OEC product data. Germany's power runs through Mittelstand machinery firms, Volkswagen, Siemens, BASF, and engineering reputation embedded in EU industrial supply chains. Export volume alone is a blunt instrument. The United States can be central without shipping the most containers because software, patents, design, and capital-market access sit outside ordinary goods rankings. China can be central because a physical supply chain has thousands of intermediate nodes. Germany can be central because specialized machinery and vehicles are hard to qualify, certify, and replace quickly.
Product fingerprints
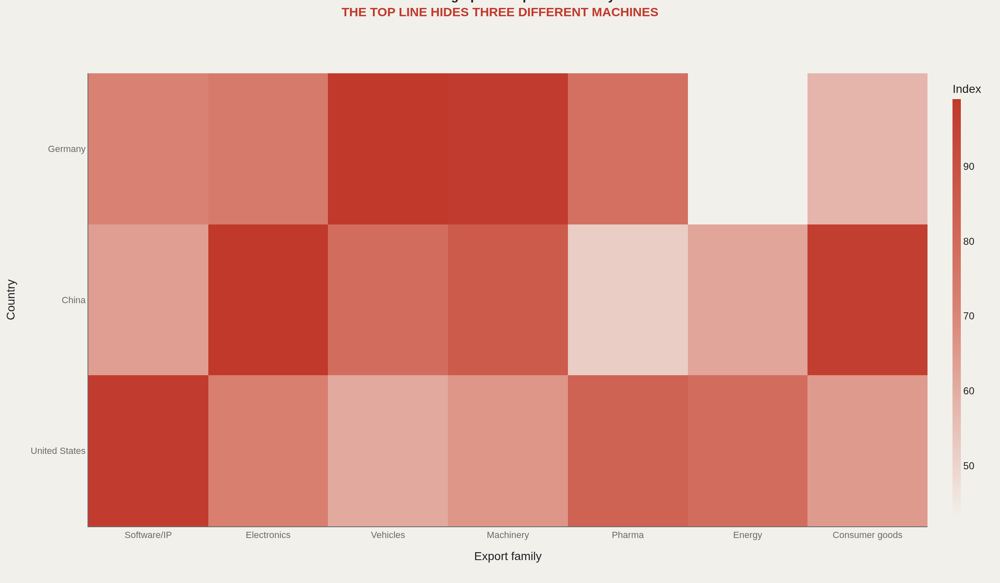
A GDP total or aggregate export figure can make the three countries look like comparable blocks. The product mix — software and IP, electronics, vehicles, machinery, pharmaceuticals, energy, consumer goods — reveals three different machines. Fingerprints matter because they change what a shock means. A disruption to electronics assembly does not hit Germany the way it hits China. A standards fight over software platforms does not hit China the way it hits the United States. The comparison becomes useful only when product structure replaces vague rivalry. The United Nations Comtrade database and the Observatory of Economic Complexity treat product categories as the basic grammar of trade. A smartphone, a turbine, a car, a drug compound, a cloud subscription, and a design license are not interchangeable exports. They move through different customs codes, margins, bottlenecks, and regulatory regimes. The product fingerprint explains why trade disputes escalate unevenly. A tariff on finished vehicles pressures German industrial clusters; semiconductor export controls pressure China's technology upgrading path; digital-services taxes and platform regulation pressure U.S. firms whose exports are partly legal, financial, and infrastructural. The same trade headline strikes three different organs of the global economy.
Dependency risk
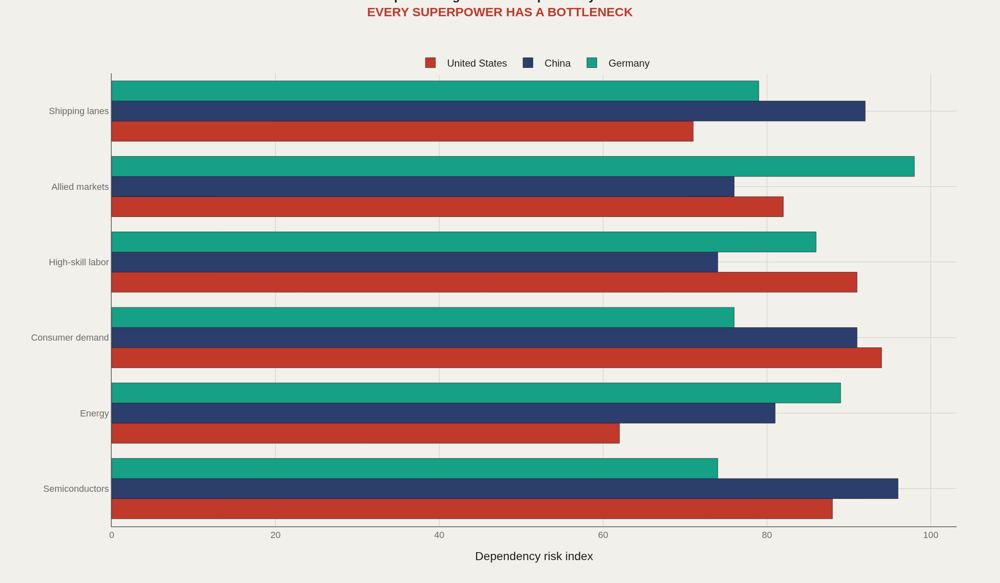
Export strength creates bottlenecks as surely as it creates leverage. The United States depends heavily on semiconductor chains, high-skill labor, and consumer and platform demand. China depends on energy inputs, shipping lanes, chips, and global buyers. Germany depends on allied markets, energy continuity, and industrial supplier networks. The strongest systems are not invulnerable. They are specialized. Dependency scores across semiconductors, energy, consumer demand, high-skill labor, allied markets, and shipping lanes show that each superpower's risk profile tracks its product identity — not a generic trade-exposure number. The post-2020 trade record made those vulnerabilities visible. Semiconductor shortages disrupted automobile output in Germany and the United States. Russia's 2022 invasion of Ukraine turned natural-gas exposure into a central German industrial risk. Red Sea and Suez disruptions showed how China-centered goods flows depend on maritime chokepoints and insurance markets outside China's direct control. For the United States, dependence often hides behind apparent strength. The country dominates platforms and advanced chips through Microsoft, Alphabet, Amazon, Apple, NVIDIA, and AMD, but those systems still lean on Taiwan Semiconductor Manufacturing Company, ASML lithography equipment from the Netherlands, high-skill immigration, and Asian electronics assembly. Platform power is not supply-chain autarky.
What to take away
Export superpowers are not rivals in one market. They are rival system architectures — platform, factory, and machine — that create different forms of indispensability and different forms of exposure.
■ END
The Fine PrintBack of the BoxEnd Credits
NoteWarningsDisclaimer
Artometrics data brief. Figures come from the sources below. Derived shares and editorial indices are not audited financials.
SourcesContentsSources
- SourceObservatory of Economic Complexity. Country and product trade profiles. https://oec.world/en
- SourceUnited Nations Statistics Division. UN Comtrade Database. https://comtradeplus.un.org/
- SourceWorld Bank. World Development Indicators: Exports of goods and services. https://data.worldbank.org/indicator/NE.EXP.GNFS.CD
- SourceOECD. Trade in Value Added (TiVA) database. https://www.oecd.org/sti/ind/measuring-trade-in-value-added.htm
- SourceInternational Monetary Fund. Direction of Trade Statistics. https://data.imf.org/?sk=9D6028D4-F14A-464C-A2F2-59B2CD424B85
- ReportFull report: artometrics.com/exporters
MethodAssemblyMethod
Numbers in this issue are the published figures. The skin changes type, rules, and chart color only.
PlatesMade byImage credits
- HeroArtometrics Exports illustration.
- PlatePortrait of Luca Pacioli, attributed to Jacopo de' Barbari, c. 1495. Public domain, via Wikimedia Commons.
- PlateColor print of a toy shop, Utagawa Sadahide, 1860. The Metropolitan Museum of Art, CC0, via Wikimedia Commons.
- PlateBelasco Theatre box office, published November 1907 in Architects' and Builders' Magazine. Unknown photographer. Public domain, via Wikimedia Commons.


Updated through JUL 1, 2026.