



JUL 1, 2026 · Exports
Exports
Film and Music Lead Cultural Exports; Korea Rose 70 Points Since 1990
Film scores 91 on exportability, music 88. South Korea's cultural wave index climbed from 22 in 1990 to 92 in 2025 across eight mediums and 45 cities.
By Kyle McAuliffe · · 4 min

Film scores 91 on exportability, music 88, and games/anime 84 across eight cultural mediums. South Korea's cultural wave index rose from 22 in 1990 to 92 in 2025, Japan compounded from 71 to 86, and India scaled from 58 to 79 over the same period. This analysis covers 8 cultural-export systems, 45 global cities in the World Cities Culture Forum dataset, and 6 diagnostic questions that convert attention into measurable trade.
The charts use editorial indices to structure the cultural-trade question before deeper alignment with UNESCO, WIPO, and platform data: what travels, where it is produced, who monetizes it, and how it becomes identity.
91
Film/TV exportability score — highest among eight cultural mediums tracked
70
Point climb in South Korea's cultural wave index, 1990 to 2025 — from 22 to 92
45
Global cities in World Cities Culture Forum 5th edition — urban geopolitics base
Soft Power and Trade
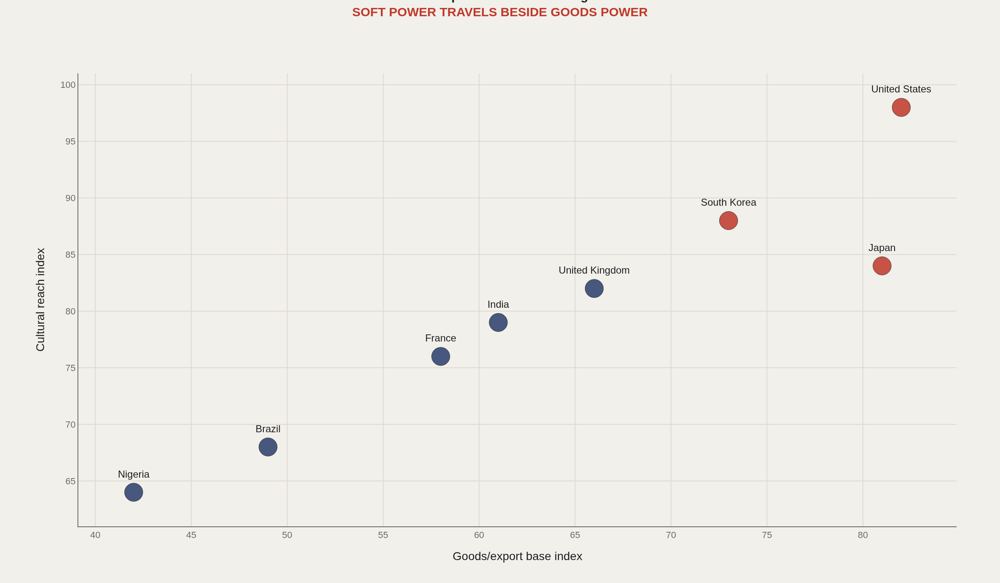
The geopolitics versus goods-power scatter places eight systems along both axes, with the strongest joint positions reaching the high 80s and 90s on the editorial scales. Culture and merchandise exports often move together, but not always in equal proportion. A country can export cars, chips, oil, or software. It can also export characters, songs, films, cuisine, style, and celebrity. Attention shifts the world's willingness to engage with the rest of the economic proposition.
Medium Exportability
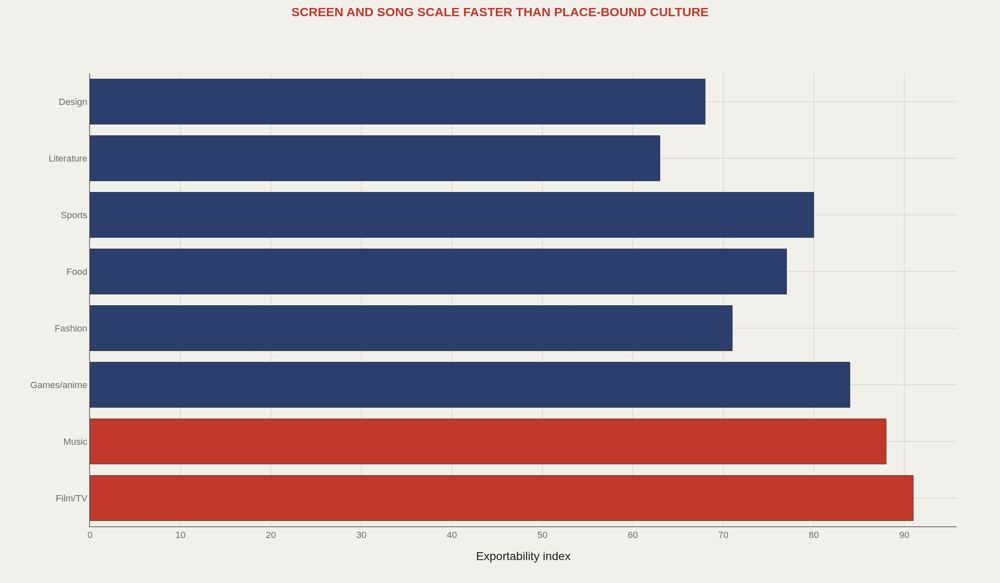
Film/TV scores 91 on exportability, music 88, and games/anime 84. Sports sits at 80, food at 77, fashion at 71, design at 68, and literature at 63 among the eight mediums. Screen and song scale through platforms with minimal need for physical presence. Place-bound culture travels too, but typically requires translation, institutional support, or logistical infrastructure.
Cultural Waves
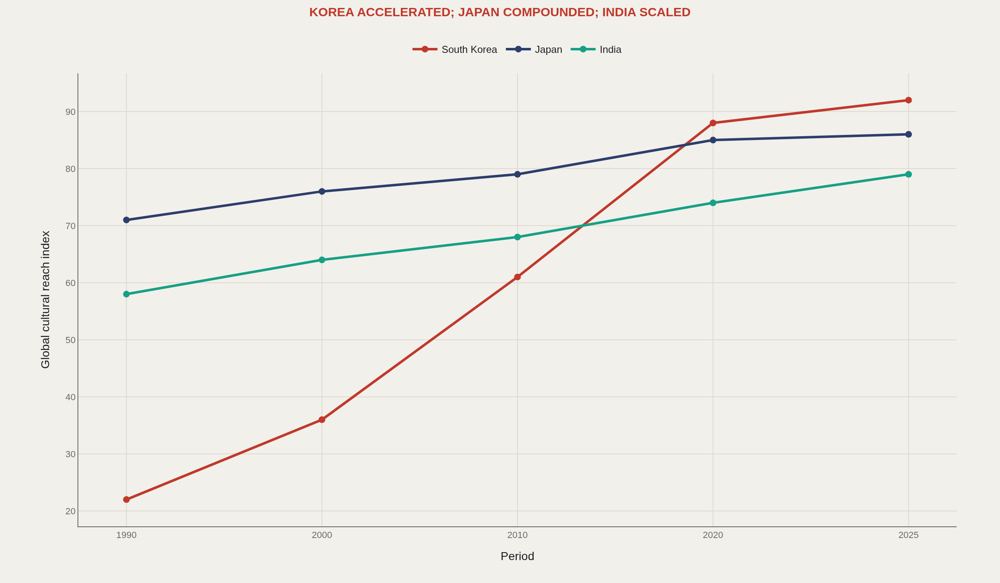
South Korea's editorial wave index rises from 22 in 1990 to 92 in 2025—a 70-point climb. Japan compounds from 71 in 1990 to 86 in 2025. India scales from 58 to 79 over the same markers. The comparison documents mechanism, not ranking: strategic acceleration, long compounding through anime, games, and design, and diaspora-plus-film scaling represent distinct patterns.
Cultural Pipeline Cities
City pipeline scores pair output base with distribution reach. The strongest joint positions sit near the top-right of the scatter (high 90s), with a descending ladder of other export cities behind them. Los Angeles-style output-distribution hubs, Seoul-style coordinated export platforms, and Tokyo-style games, anime, and design engines function as urban launchpads for national soft power.
Cultural Trade Questions
The diagnostic ranking elevates what becomes identity (96), what travels (94), what platform scales it (91), who monetizes it (89), what city produces it (86), and who translates it (82). Those questions convert culture into a measurable export system without collapsing it to ticket revenue alone. Attention is the cargo; identity is the durable inventory.
What to take away
Cultural exports belong in geoeconomics because attention moves markets: tourism, language learning, fashion, food demand, and diplomatic standing.
Screen and music travel fastest on these indices; South Korea, Japan, and India show distinct wave patterns; cities function as production and distribution launchpads. Replace the indices with direct data before treating the scores as league tables.
■ END
The Fine PrintBack of the BoxEnd Credits
NoteWarningsDisclaimer
Artometrics data brief. Figures come from the sources below. Derived shares and editorial indices are not audited financials.
SourcesContentsSources
- SourceUNESCO Institute for Statistics and UNESCO cultural trade references.
- SourceWIPO creative economy and intellectual property indicators.
- SourceWorld Cities Culture Forum. CREATIVE Data Framework.
- SourceMusicBrainz / MetaBrainz dumps.
- SourceIMDb/TMDb/Wikidata public metadata references.
- SourceWorld Bank and OECD services and export datasets.
- ReportFull report: artometrics.com/geopolitics
MethodAssemblyMethod
Numbers in this issue are the published figures. The skin changes type, rules, and chart color only.
PlatesMade byImage credits
- HeroArtometrics Exports illustration.
- PlatePortrait of Luca Pacioli, attributed to Jacopo de' Barbari, c. 1495. Public domain, via Wikimedia Commons.
- PlateColor print of a toy shop, Utagawa Sadahide, 1860. The Metropolitan Museum of Art, CC0, via Wikimedia Commons.
- PlateBelasco Theatre box office, published November 1907 in Architects' and Builders' Magazine. Unknown photographer. Public domain, via Wikimedia Commons.


Updated through JUL 1, 2026.