



APR 18, 2026 · Giants
Giants
Three Titles in Five Years at Payroll Nine
San Francisco's 2010–2014 dynasty won three titles with a draft-built rotation at mid-tier payroll—then couldn't replicate the model.
By Kyle McAuliffe · · 5 min
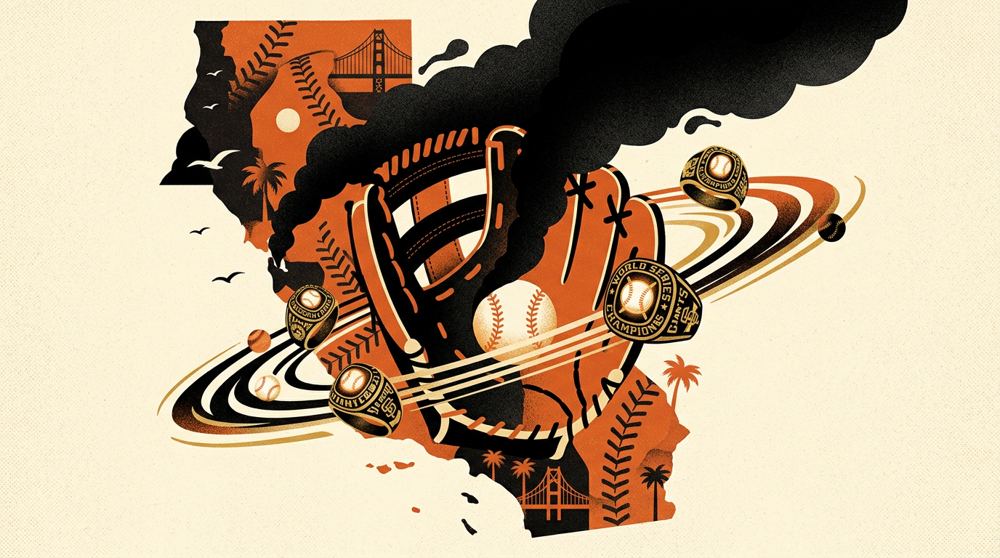
The Giants won the 2010 World Series while ranking ninth in MLB payroll, fielding a rotation assembled almost entirely from the draft. They won again in 2012 at rank eight and in 2014 at rank four—three titles in five years without monopolizing free agency. Then the window closed.
Rank 9
Giants' 2010 payroll position when they won their first San Francisco dynasty title, with Lincecum, Cain, and Bumgarner all drafted in-house
3.3 million
Oracle Park's opening-season attendance in 2000, nearly double Candlestick's worst years and a floor the franchise held through rebuilds
8
Total World Series titles across 141 seasons: five in New York (1905, 1921, 1922, 1933, 1954), three in San Francisco (2010, 2012, 2014)
141 years of winning—and the gaps that defined them
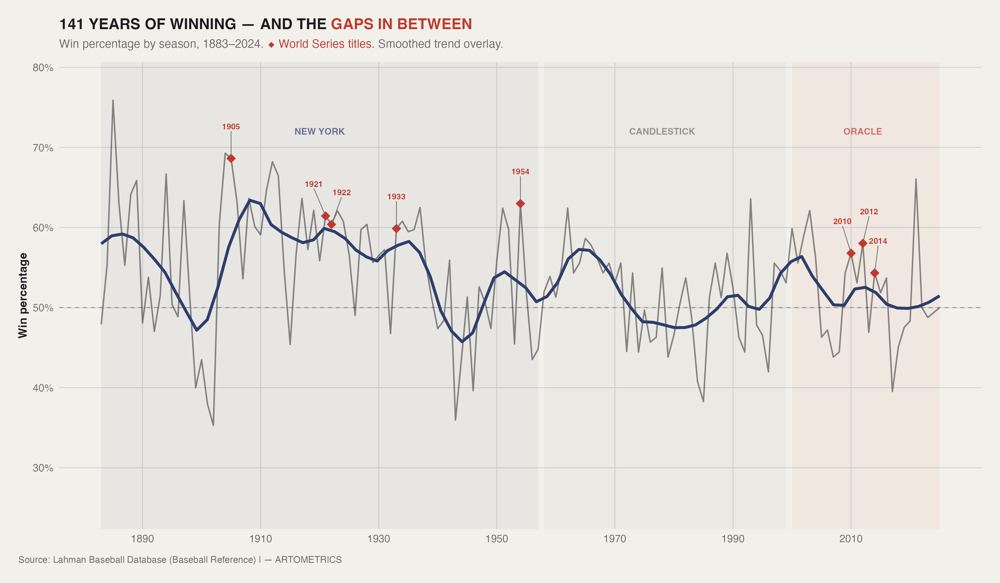
The New York Giants were one of baseball's best franchises for the first half of the twentieth century. The smoothed trend holds above .500 from the 1890s through 1957, with five World Series titles and long runs under John McGraw and Bill Terry. McGraw's 1903–1932 tenure remains one of the sport's longest managerial dynasties. This was not occasional success—it was the standard. The 1958 move to San Francisco broke that momentum and did not restore it for fifty years. Candlestick produced pennants in 1962 and 1989—seven-game losses and an earthquake-interrupted Series—but the trend flatlined just below .500. Mays, McCovey, and Marichal were Hall of Fame talent without a San Francisco championship. The 1978 low of .383 was the worst since the Dead Ball era. The Oracle era marks the sharpest structural break. From 2000 onward the raw line grows more volatile, but the smoothed trend climbs into the 2010–2014 window before receding after 2016. What the smoother cannot show is the mechanism: a front office that developed its own pitching, built around Buster Posey, and won three titles in five years with a roster that looked nothing like a bought dynasty. The post-2016 dip toward .400 marks the Zaidi rebuild—an unfinished chapter the data tracks but does not resolve.
Oracle Park raised the floor before the dynasty arrived
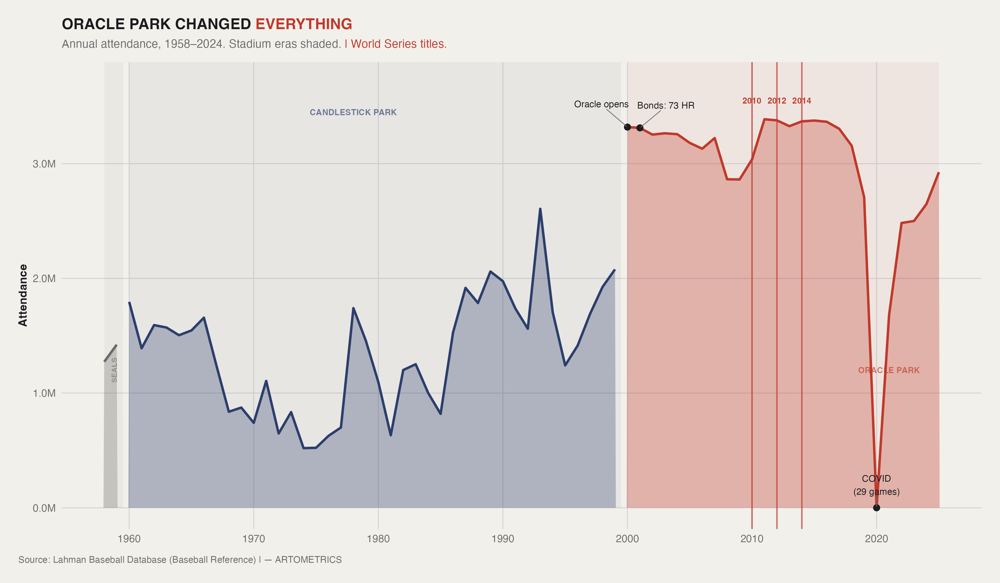
Candlestick was miserable in ways difficult to convey to anyone who never sat a night game there. Wind off the Bay knocked over coffee cups; Vin Scully called it the worst ballpark in baseball. Attendance followed: multiple 1970s seasons under 700,000, the worst figures in the National League. Even the 1989 pennant winners drew 2.1 million—a total Oracle routinely exceeded in rebuilding years. Oracle Park opened April 11, 2000, and drew 3.3 million in its first season. That jump—from 2.1 million in Candlestick's final year to 3.3 million without a title team—is the most important financial event in franchise history. Privately financed on the waterfront, it was the first MLB stadium without public money since Dodger Stadium in 1962, meaning the Giants owned the revenue streams. From 2000 onward, a floor Candlestick never established held. Post-Bonds years (2007–2009) dipped to 2.8 million at the low—still 700,000 above Candlestick's competitive peaks. Dynasty years pushed attendance back above 3.3 million. COVID was the only real interruption; recovery near 3.0 million by 2024 confirms the ballpark sells itself even when the roster does not.
The dynasty was built on draft cost, not free-agent monopoly
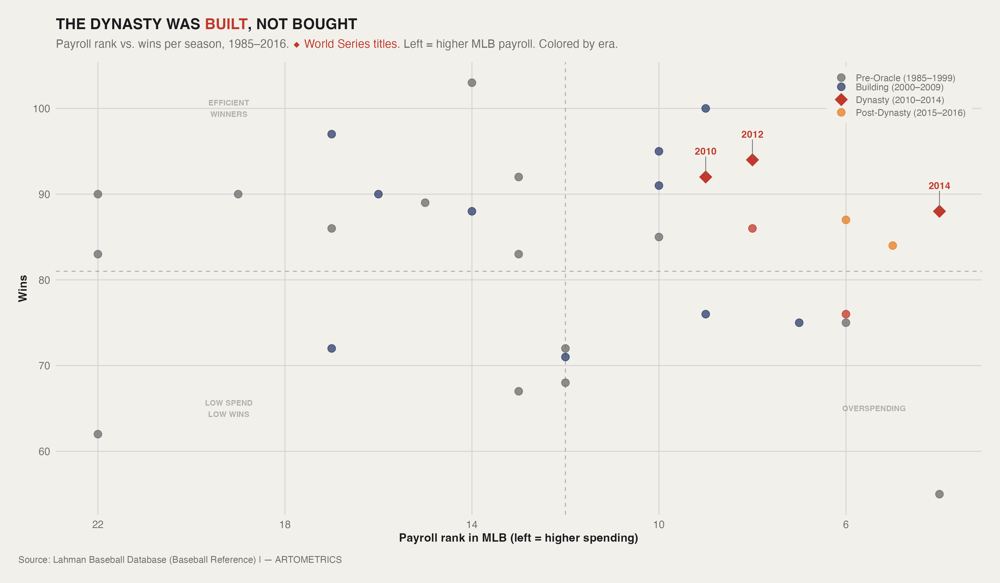
Thirty-two seasons of payroll history show that money and wins never had a clean relationship in San Francisco. Pre-Oracle points scatter across mid-league spending and inconsistent results. Bonds arrived in 1993 on then-record free-agent money. The spending was real. The championships were not. The dynasty cluster is clearer. In 2010 the Giants ranked ninth in payroll, won 92 games, and won the World Series. In 2012 they ranked eighth and won 94. 2014 is the standout: payroll rank 4 with 88 wins, surviving the Wild Card and four rounds. What connects all three is not spending level but what the money bought. Lincecum, Cain, Bumgarner, and Posey were drafted in San Francisco—cheap on arrival, elite before arbitration reset the cost. Payroll rose as they were paid for work already done. By 2015–2016, top-5 payrolls returned 75 to 87 wins. The draft pipeline had slowed; the club paid market price for replacements that could not match what development had built. The window opens when homegrown players are still cheap and closes when they require market contracts. The Giants rode it for five years and won three times. Most franchises never ride it once.
■ END
The Fine PrintBack of the BoxEnd Credits
NoteWarningsDisclaimer
Artometrics data brief. Figures come from the sources below. Derived shares and editorial indices are not audited financials.
SourcesContentsSources
- SourceLahman, S. (2024). Lahman Baseball Database (Version 11.0). Retrieved from http://www.seanlahman.com/baseball-archive/statistics/
- SourceFriendly, M., Dalzell, C., Monkman, M., & Murphy, D. (2021). Lahman: Sean 'Lahman' Baseball Database (R package version 10.0-1). Retrieved from https://CRAN.R-project.org/package=Lahman
- SourceBaseball Reference. (2024). San Francisco Giants franchise history. Sports Reference LLC. Retrieved from https://www.baseball-reference.com/teams/SFG/
- SourceJames, B. (2001). The New Bill James Historical Baseball Abstract. Free Press.
- SourceSchwarz, A. (2004). The Numbers Game: Baseball's Lifelong Fascination with Statistics. Thomas Dunne Books.
- SourceBrown, G. (2012). The San Francisco Giants: 50 Years. Arcadia Publishing.
- SourceRelated Artometrics report: Padres
- SourceRelated Artometrics report: Dodgers
- SourceRelated Artometrics report: Yankees
- ReportFull report: artometrics.com/giants
MethodAssemblyMethod
Numbers in this issue are the published figures. The skin changes type, rules, and chart color only.
PlatesMade byImage credits
- HeroArtometrics Giants illustration.
- PlatePortrait of Luca Pacioli, attributed to Jacopo de' Barbari, c. 1495. Public domain, via Wikimedia Commons.
- PlateColor print of a toy shop, Utagawa Sadahide, 1860. The Metropolitan Museum of Art, CC0, via Wikimedia Commons.
- PlateBelasco Theatre box office, published November 1907 in Architects' and Builders' Magazine. Unknown photographer. Public domain, via Wikimedia Commons.


Updated through APR 18, 2026.