



JUN 15, 2026 · Horror
Horror
Horror Ratings Rose as Catalog Volume Grew 50× in Seven Decades
32,540 horror films from 1950–2022 show median vote average climbed from 5.65 to 6.00 — modest quality gain amid explosive catalog growth.
By Kyle McAuliffe · · 3 min

The median vote average for horror films climbed from 5.65 to 6.00 between 1950 and 2022 — a 0.35-point rise across seven decades that added 32,540 titles to the catalog.
TMDB metadata for horror-tagged films yields 32,540 records from 1950–2022. The median vote average is 4.00; the highest observed average is 10.0. Horror is the most common primary genre label, as expected in a horror-tagged extract.
32,540
Total horror films analyzed, 1950–2022
4.00
Median vote average across entire catalog
0.35
Increase in median rating from early period (5.65) to close (6.00)
How the pattern changed over time
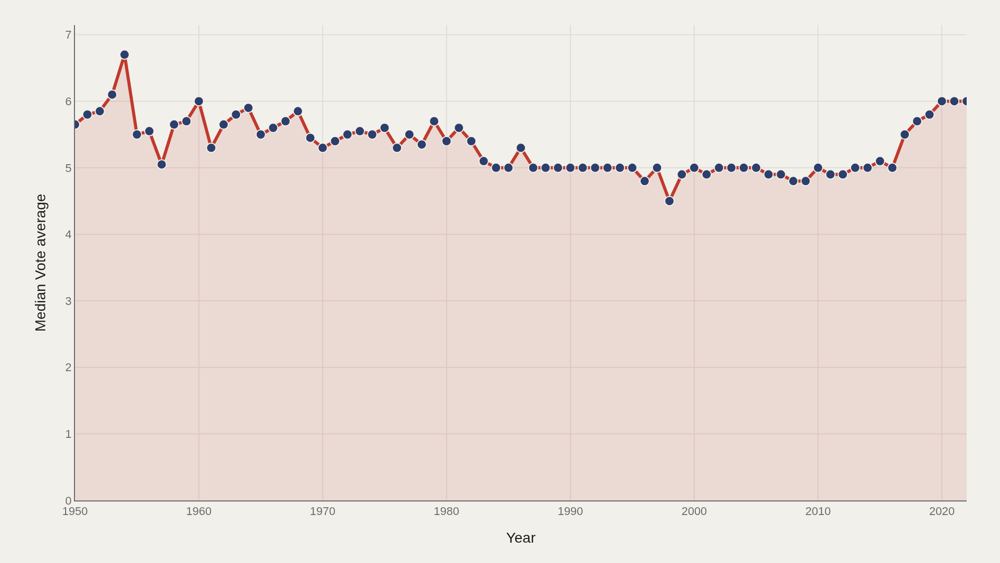
Median vote average rises from 5.65 in the opening period to 6.00 at the close — a 0.35-point lift across decades of catalog growth. Volume exploded while the middle of the scoreboard edged up. More titles filled the shelf; the median shifted modestly upward rather than holding flat or declining.
Who sits at the top
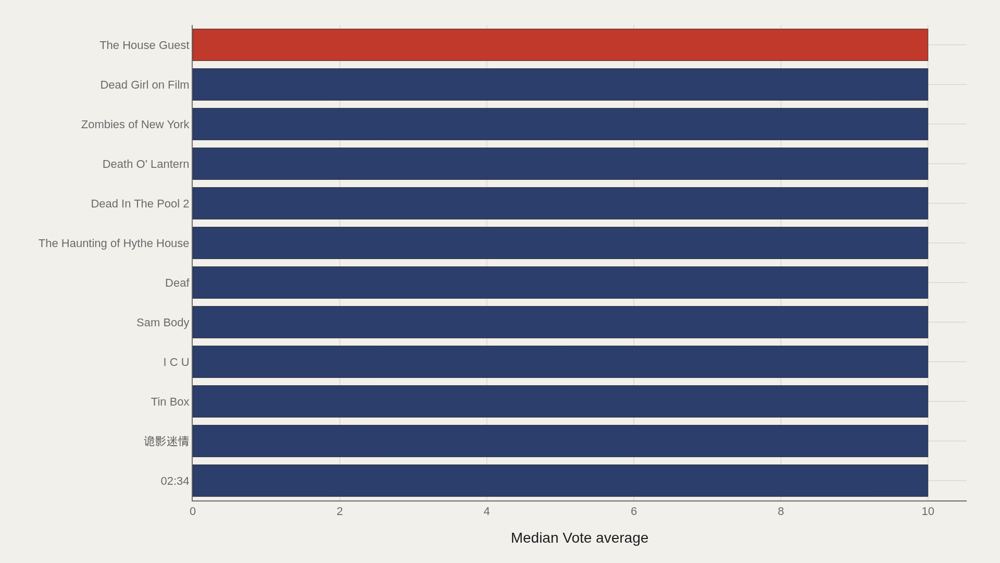
The House Guest leads at 10.0, and 10.0 also marks the median among the top dozen. The head of the leaderboard is a cluster of perfect averages, not a gentle taper. In large rating tables, that pattern signals low vote counts or niche titles with small, enthusiastic rater pools. The top is a ceiling effect, not a ranked canon.
How the field is spread
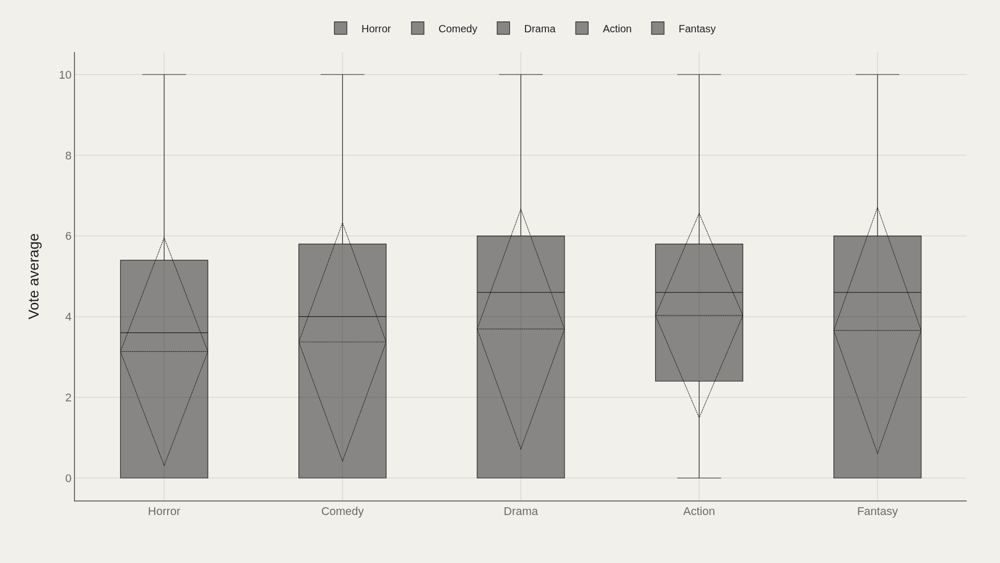
Primary-genre boxes reveal whether vote averages converge across hybrid tags or split by outliers. Horror-tagged films carry secondary labels — crime, animation, drama — and those buckets disagree about quality. Consensus is uneven once the tag set widens.
Who beats the median — and who trails
Crime sits 1.00 above the median; Animation trails by 4.00. Those gaps are relative to this file's middle, not absolute statements about every crime or animated horror title. They mark where hybrid labeling and rater pools pull averages apart.
What moves together
Vote average and vote count do not move as a simple line. Perfect scores with tiny counts sit apart from widely watched mid-range films. Popularity and perceived quality are related but not interchangeable — the scatter shows where that distinction becomes visible.
What to take away
The median vote average rose 0.35 points (5.65 to 6.00) as the catalog expanded by tens of thousands of titles. Perfect 10.0 leaders reflect sparse vote counts rather than broad acclaim.
Read leaders, gaps, and the average–count scatter together before treating any title as proof of a golden age.
■ END
The Fine PrintBack of the BoxEnd Credits
NoteWarningsDisclaimer
Artometrics data brief. Figures come from the sources below. Derived shares and editorial indices are not audited financials.
SourcesContentsSources
MethodAssemblyMethod
Numbers in this issue are the published figures. The skin changes type, rules, and chart color only.
PlatesMade byImage credits
- HeroArtometrics Horror illustration.
- PlatePortrait of Luca Pacioli, attributed to Jacopo de' Barbari, c. 1495. Public domain, via Wikimedia Commons.
- PlateColor print of a toy shop, Utagawa Sadahide, 1860. The Metropolitan Museum of Art, CC0, via Wikimedia Commons.
- PlateBelasco Theatre box office, published November 1907 in Architects' and Builders' Magazine. Unknown photographer. Public domain, via Wikimedia Commons.


Updated through JUN 15, 2026.