



JUN 15, 2026 · Hurricanes
Hurricanes
Maria's 2017 Peak Hammered Puerto Rico in a Three-State Season
Texas, Florida, and Puerto Rico absorbed 100% of measured 2017 hurricane impact in 153-record TidyTuesday extract; median reading 703, ceiling 5,072.
By Kyle McAuliffe · · 4 min
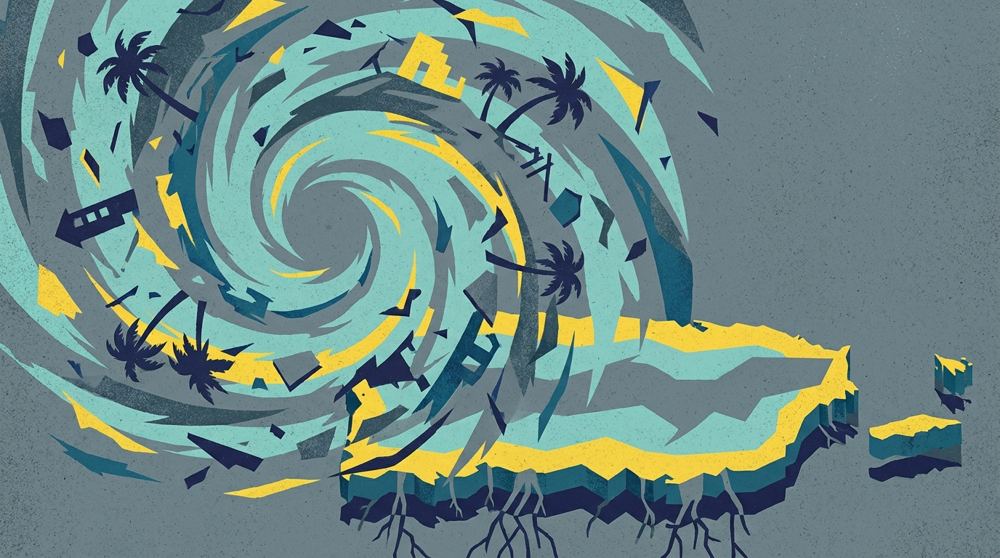
Three places absorbed 100% of measured hurricane impact in the 2017 TidyTuesday extract: Texas leads state totals at 983, Florida follows, and Puerto Rico recorded the season's 5,072 peak.
The 153-record file from the R for Data Science community tracks intensity values across the late-summer Atlantic window. Median reading is 703; the right-skewed distribution pushes mean to 1,020. The top decile begins at 2,214—the threshold where defining storm days separate from elevated but survivable readings.
This is not a full Caribbean cyclone climatology. It is a season-slice that places Texas, Florida, and Puerto Rico side by side on intensity, concentration, and timing.
5,072
Season ceiling recorded in Puerto Rico, 7.2× the 703 median
100%
Share of aggregate value held by three-place head (Texas, Florida, Puerto Rico)
2,214
Top-decile threshold, where defining storm days begin
Timeline across states
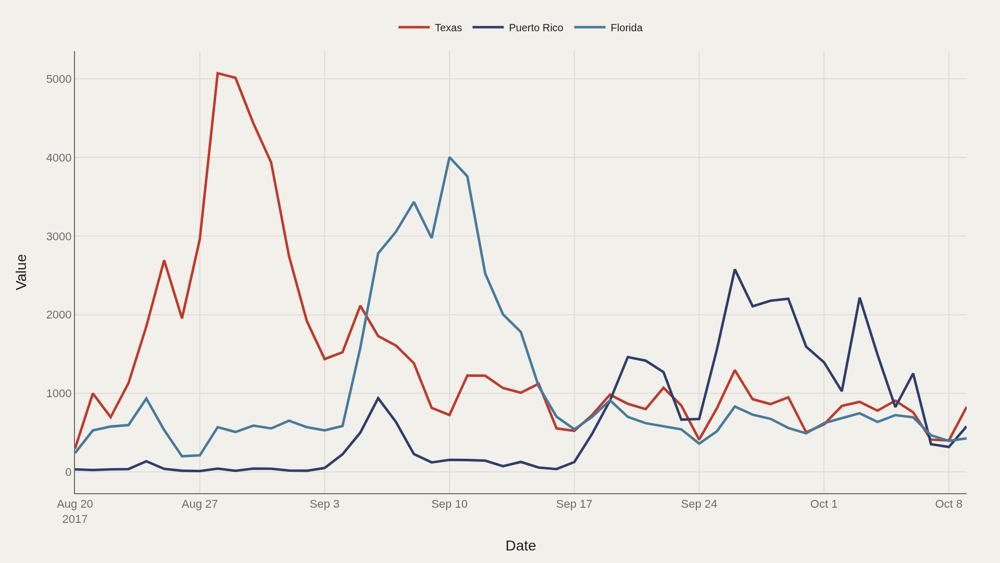
Daily value lines separate which state or territory bore the brunt on which days. Peaks rarely align. Texas, Florida, and Puerto Rico experienced the same basin season on different clocks—landfall timing and local intensity created staggered curves rather than a single shared crest. The 5,072 maximum defines the intensity ceiling. Everything else in the file is read relative to that spike and to the 703 median.
Who sits at the top
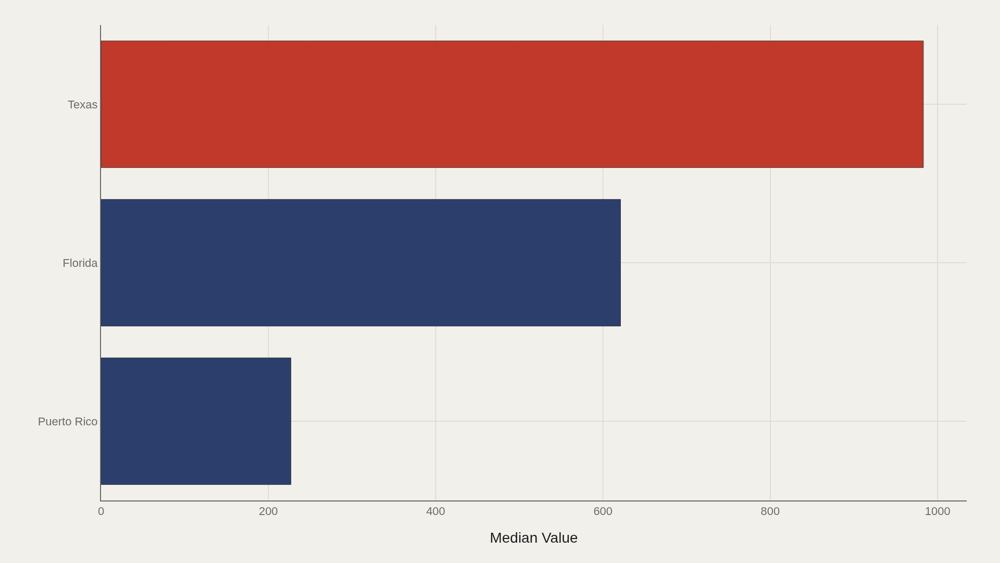
Texas leads at 983; median among the top dozen entries is 621. Florida and Puerto Rico complete the short list of places that dominate the aggregate signal. A short leaderboard is itself a finding: storm impact is not evenly distributed across dozens of states. A handful of geographies carry the measurable season.
How values are spread
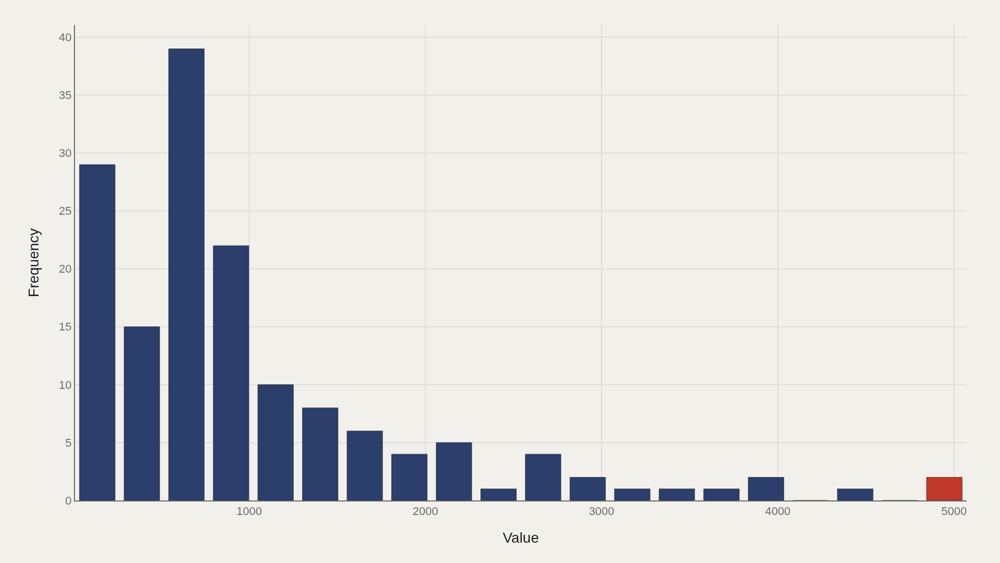
Right-skewed distribution: median 703 versus mean 1,020. The top decile begins at 2,214. That tail is where the defining storm days live—and why a mean-based summary sounds more extreme than a typical day in the file. Skewness is the statistical signature of disaster data. Most observations are elevated but survivable; a minority of days rewrite the season's memory.
Concentration of impact
The top three state or territory entries account for 100% of the aggregate value. The Pareto curve is not merely steep—it is a three-place map. That concentration explains why comparative journalism about 2017 returned to Texas, Florida, and Puerto Rico. The file's structure matches public memory: a short head, not a long list of mildly affected places.
Concentration, from another cut
A second concentration chart repeats the same structural claim from a related table cut: the measurable aggregate is carried by the same three-place head. Steep Pareto curves mean a small head drives most of the signal. For Puerto Rico, the lesson is not that other places did not suffer. In this season-slice, comparative magnitude collapses onto a tiny set of names—and Puerto Rico is inside that set.
What to take away
The 2017 window in this file is a story of concentration: median 703, ceiling 5,072, and an aggregate dominated by three places. Texas leads the ranking cut; Puerto Rico holds the season's peak.
Disaster seasons are not democratic distributions. They are skewed clocks. The citable map is the short head of places where the season actually happened.
■ END
The Fine PrintBack of the BoxEnd Credits
NoteWarningsDisclaimer
Artometrics data brief. Figures come from the sources below. Derived shares and editorial indices are not audited financials.
SourcesContentsSources
- SourceTidyTuesday release from 2018-06-19, published by the R for Data Science community. The working file contains 153 rows and 4 columns after cleaning—a narrow table built for cross-state comparison in the 2017 window.
- ReportFull report: artometrics.com/hurricanes
MethodAssemblyMethod
Numbers in this issue are the published figures. The skin changes type, rules, and chart color only.
PlatesMade byImage credits
- HeroArtometrics Hurricanes illustration.
- PlatePortrait of Luca Pacioli, attributed to Jacopo de' Barbari, c. 1495. Public domain, via Wikimedia Commons.
- PlateColor print of a toy shop, Utagawa Sadahide, 1860. The Metropolitan Museum of Art, CC0, via Wikimedia Commons.
- PlateBelasco Theatre box office, published November 1907 in Architects' and Builders' Magazine. Unknown photographer. Public domain, via Wikimedia Commons.


Updated through JUN 15, 2026.