



APR 14, 2026 · Empires
Empires
What Empire Chronicles Leave Out
A historical-economics lens asks who captured wealth when rulers claimed order.
By Kyle McAuliffe · · 5 min
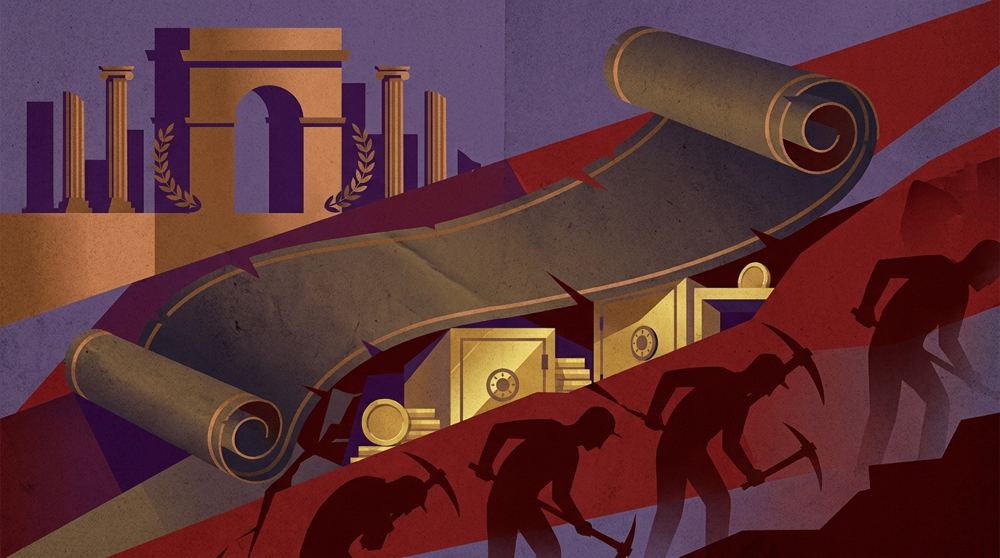
Every empire in history has told the same story about itself: we brought order, we built roads, we made the trains run on time. What the chronicles leave out is the spreadsheet. Who actually got richer? How long did the prosperity last? And when it ended, how fast did it go?
Those questions have answers now. The Maddison Project Database — the most comprehensive long-run economic dataset ever assembled — lets us put Rome, Britain, the Ottomans, Imperial China, the Mongols, and Habsburg Spain on the same chart and ask: what does empire actually look like as an economic system?
The answer is not what the history textbooks imply. GDP goes up. Real wages mostly don’t. The rise takes centuries. The fall takes decades. And in every case, the institutions built to extract surplus during expansion become structurally incapable of sharing it during maturation. That’s the pattern. Six empires. No exceptions.
1,200 yrs
Time for Western Europe to recover Rome's peak GDP per capita after the 476 CE collapse
23%
Share of global population governed by the British Empire at its 1920 territorial peak — 412 million people
~7×
Number of times Imperial China cycled through full unification and fragmentation between 221 BCE and 1912 CE
Gdp Per Capita Across Empire Cores
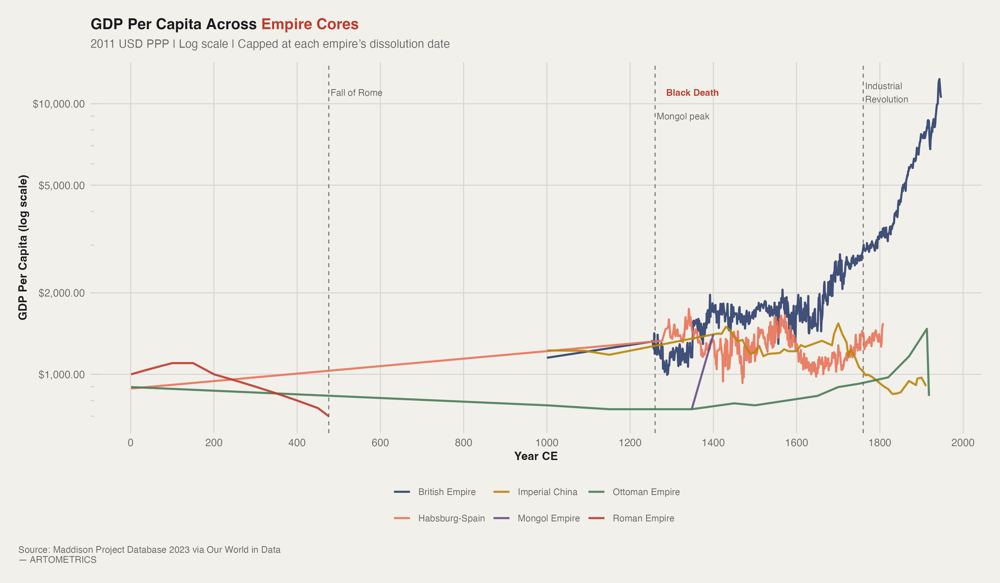
For the first 1,800 years of this chart, five of the six empire cores are essentially stationary. Rome peaks early and declines. The Ottomans and Imperial China drift sideways for centuries. Habsburg Spain — despite controlling the most silver-producing territory in human history — never generates a GDP breakout. The Mongol blip in the 1260s appears and vanishes within a century. The chart’s visual drama is entirely a British phenomenon, and it doesn’t begin until roughly 1800. That flatness is not a data artifact. Pre-industrial economies were governed by a hard ceiling: agricultural productivity. Every empire eventually hit the same constraint — you can conquer more land, you can tax more efficiently, you can build better roads — but you cannot grow aggregate output faster than the soil can produce food. This is why five empires operating across four millennia produce nearly identical GDP trajectories. They were all playing the same zero-sum game. The temptation when looking at Chart 1 is to conclude that Britain governed better. This is wrong. The British divergence is a technology story, not an institutional one. Steam power — specifically the transition from organic energy (human labor, animal muscle, firewood) to fossil energy (coal) — removed the agricultural ceiling entirely. British GDP per capita in 1900 is not high because of better laws or smarter monarchs. It is high because coal-powered factories could produce manufactured goods at a scale that no farming economy could match, and Britain industrialized first. The Roman GDP line in this dataset is a back-extrapolation built from Maddison (2007), Scheidel and Friesen (2009), and Lo Cascio and Malanima (2009) — the best available estimates, with significant uncertainty bands. At roughly $1,000–1,200 in 2011 USD PPP, the Roman Empire’s peak was genuinely impressive for its era. It represents something like double the GDP per capita of its contemporaries and suggests a level of market integration — trans-Mediterranean trade, monetized labor, professional armies — that would not reappear in Europe for a thousand years after the Western collapse.
What to take away
Six empires. Four thousand years. The curve barely changes. A period of administrative consolidation reduces transaction costs, enables infrastructure at scale, and produces a GDP spike. That spike is real — it shows up in the Maddison data clearly. What it conceals is who captured the gains — and Chart 3 is where the concealment ends.
In every empire with wage data, the extraction gap widens during peak imperial expansion. British GDP per capita grew roughly 150% between 1700 and 1850. Real wages for English laborers grew approximately 30–40% over the same window. The rest went to rents, dividends, and colonial surplus. The Ottoman and Habsburg cases are more extreme. Habsburg Spain extracted the largest silver haul in pre-industrial history and produced domestic wage stagnation. More money in the system; less in the wage earner’s hand.
■ END
The Fine PrintBack of the BoxEnd Credits
NoteWarningsDisclaimer
Artometrics data brief. Figures come from the sources below. Derived shares and editorial indices are not audited financials.
SourcesContentsSources
- SourceThe core economic series come from the Maddison Project Database and associated long-run GDP reconstructions by Angus Maddison, Jutta Bolt, Jan Luiten van Zanden, Elio Lo Cascio, Paolo Malanima, Walter Scheidel, and Steven Friesen. These…
- SourceThe wage-side interpretation relies on Robert Allen’s European wage series, Özmucur and Pamuk’s Ottoman reconstruction, and Allen, Bassino, Ma, Moll-Murata, and van Zanden’s China/Asia wage work because GDP per capita alone cannot identi…
- SourceAllen, R. C. (2001). The great divergence in European wages and prices from the Middle Ages to the First World War. Explorations in Economic History, 38(4), 411–447.
- SourceAllen, R. C., Bassino, J. P., Ma, D., Moll-Murata, C., & van Zanden, J. L. (2011). Wages, prices, and living standards in China, 1738–1925. Economic History Review, 64(S1), 8–38.
- SourceBolt, J., & van Zanden, J. L. (2024). Maddison style estimates of the evolution of the world economy: A new 2023 update. Journal of Economic Surveys, 1–41. https://doi.org/10.1111/joes.12618
- SourceGoldstone, J. A. (1991). Revolution and rebellion in the early modern world. University of California Press.
- SourceLo Cascio, E., & Malanima, P. (2009). GDP in pre-modern agrarian economies (1–1820 AD): A revision of the estimates. Rivista di Storia Economica, 25(3), 391–420.
- SourceMorris, I. (2013). The measure of civilization: How social development decides the fate of nations. Princeton University Press.
- SourceÖzmucur, S., & Pamuk, Ş. (2002). Real wages and standards of living in the Ottoman Empire, 1489–1914. Journal of Economic History, 62(2), 293–321.
- SourcePomeranz, K. (2000). The great divergence: China, Europe, and the making of the modern world economy. Princeton University Press.
- SourceScheidel, W. (2017). The great leveler: Violence and the history of inequality from the stone age to the twenty-first century. Princeton University Press.
- SourceScheidel, W., & Friesen, S. J. (2009). The size of the economy and the distribution of income in the Roman Empire. Journal of Roman Studies, 99, 61–91.
- SourceTurchin, P. (2006). War and peace and war: The rise and fall of empires. Pi Press.
- SourceTurchin, P., & Nefedov, S. A. (2009). Secular cycles. Princeton University Press.
- ReportFull report: artometrics.com/imperial
MethodAssemblyMethod
Numbers in this issue are the published figures. The skin changes type, rules, and chart color only.
PlatesMade byImage credits
- HeroArtometrics Empires illustration.
- PlatePortrait of Luca Pacioli, attributed to Jacopo de' Barbari, c. 1495. Public domain, via Wikimedia Commons.
- PlateColor print of a toy shop, Utagawa Sadahide, 1860. The Metropolitan Museum of Art, CC0, via Wikimedia Commons.
- PlateBelasco Theatre box office, published November 1907 in Architects' and Builders' Magazine. Unknown photographer. Public domain, via Wikimedia Commons.


Updated through APR 14, 2026.