



JUN 15, 2026 · Languages
Languages
Glottolog's 8,612 Records Map Fieldwork, Not Where People Speak
2,363 of 8,612 language records sit in Africa's macroarea bucket — a signal of documentation density, not speaker counts.
By Kyle McAuliffe · · 5 min
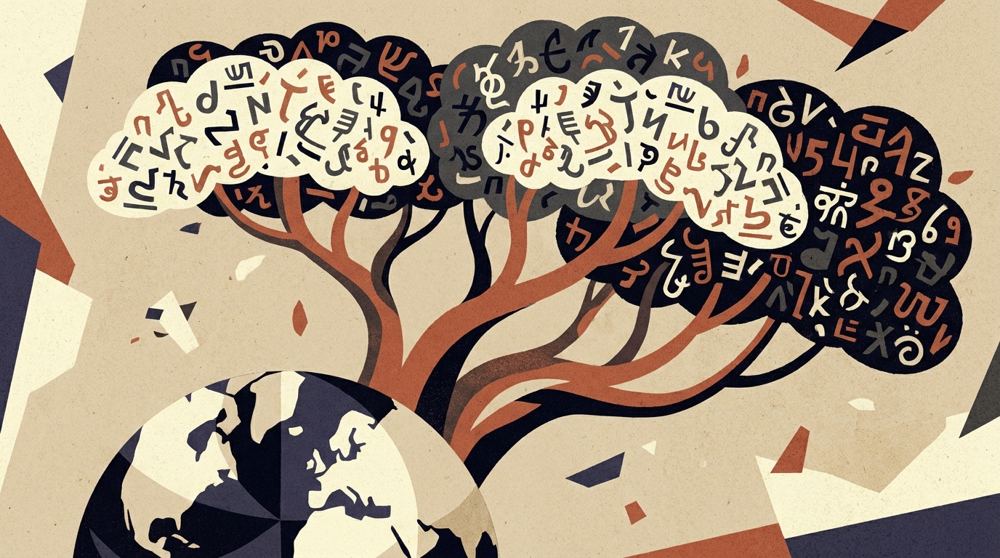
2,363 of 8,612 language records in a Glottolog-derived TidyTuesday extract sit in the Africa macroarea bucket — 27% of the catalog. The concentration maps documentation density — where grammars, identifiers, and fieldwork accumulate — not the lived geography of speech.
The working file holds 8,612 records. Africa is the largest macroarea at 2,363 entries; most language names appear once while a short head repeats. Row counts are not speaker counts, and macroarea labels are database shortcuts, not political borders.
2,363
Africa records in 8,612-row extract — 27% of total catalog visibility
8,612
Total records in working file — singleton majority, repeated-name minority
Fasu
Top recurring name — reflects dialect clusters and alternate glottonyms, not speaker count
A geographically uneven landscape
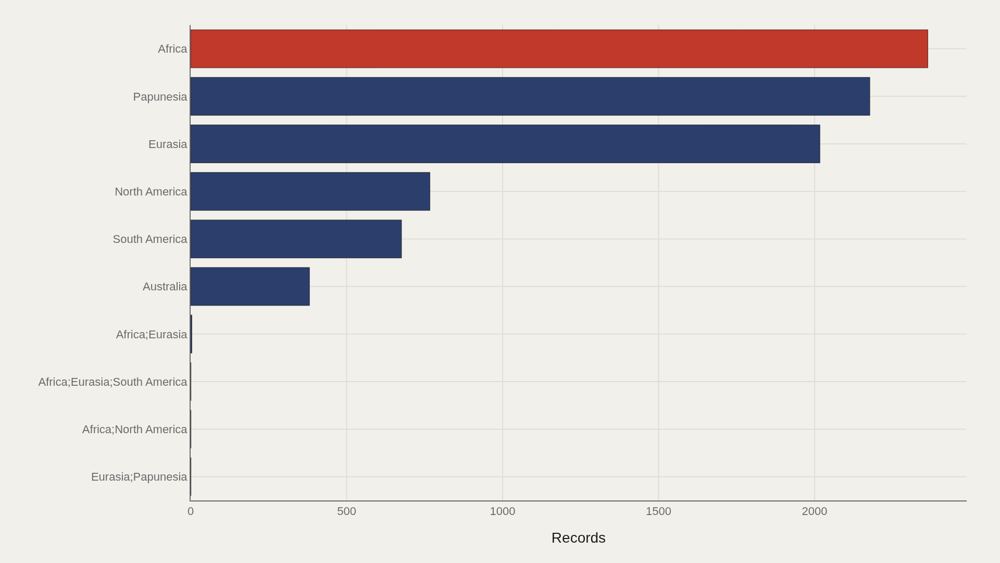
Africa dominates with 2,363 records in the primary macroarea cut. Other macroareas — Papunesia, Eurasia, the Americas, Australia — follow at lower counts. The main bucket carries 27% of the story; this field does not behave like a gentle long-tail split across dozens of equal regions. Uneven documentation is not identical to uneven linguistic diversity, but it shapes what comparative science can see. Extinction risk, revitalization, and typology research all inherit the map of what has been recorded. Africa's lead is plausible in linguistic terms: the continent contains large families such as Niger-Congo, Afro-Asiatic, Nilo-Saharan groupings as traditionally defined, and Khoisan-associated lineages, alongside intense contact zones and multilingual states. But the chart does not validate any particular family taxonomy; it records how the Glottolog-style file assigns macroarea metadata to rows. Papunesia and Australia are especially important comparison cases because they contain many small language communities with high typological diversity and severe endangerment pressure. A lower row count than Africa does not mean lower scientific importance. It means the record is distributed unevenly across regions, fieldwork histories, and naming conventions.
Who sits at the top of name repetition
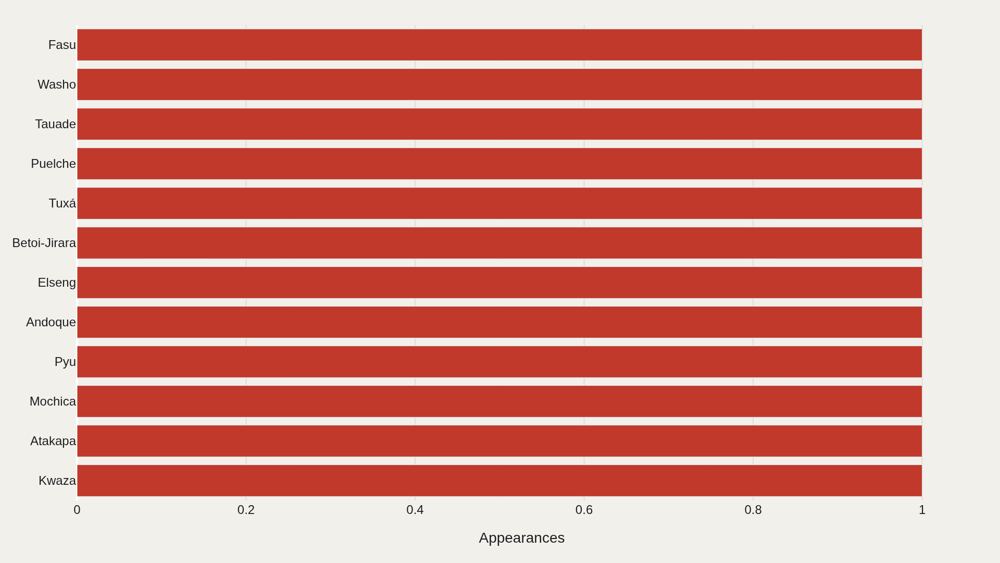
Fasu appears among the recurring names in the file; the top dozen account for a visible share of all 8,612 rows even though most languages appear only once. Name repetition can reflect dialect documentation, alternate glottonyms, or multiple database entries tied to related varieties. Fasu is a Papuan language name associated with Papua New Guinea, and its recurrence is a reminder that catalog entries are not always one-to-one with what a lay reader calls a language. Varieties, dialect clusters, alternate names, bibliographic records, and genealogical nodes can all push the same surface name into repeated view. This is where Glottolog's infrastructure differs from a census. A national census might ask who speaks a language at home; Glottolog asks how a language or lineage is classified and documented in the linguistic literature. The same community can be highly visible in one system and nearly invisible in another.
Regional concentration
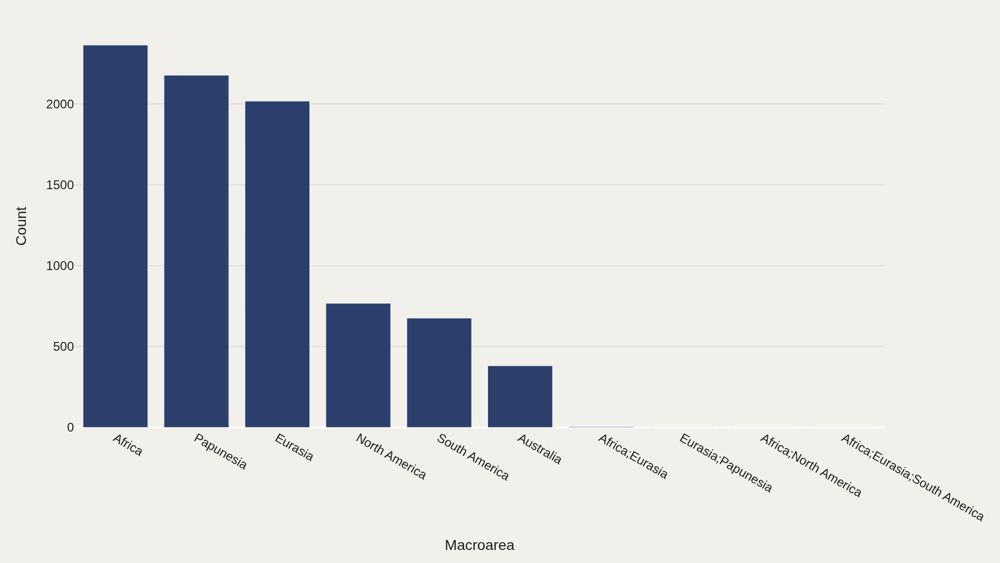
Africa is again the largest bucket with 2,363 records on the regional concentration chart. Category concentration shows where editorial and scientific attention should look first if the goal is to understand the file's center of gravity. Mixed macroarea labels in the data — combinations such as Eurasia with Papunesia — remind readers that languages and contact zones do not always respect tidy continental borders. The macroarea scheme is a practical database compromise. Eurasia contains Indo-European, Uralic, Turkic, Sino-Tibetan, Japonic, Koreanic, Dravidian, and many other lineages; the Americas contain hundreds of Indigenous languages with colonial-era documentation gaps; Papunesia compresses a spectacularly dense set of Papuan and Austronesian histories into one label. The labels help chart structure, but they are not theory in themselves. Regional concentration also encodes academic history. Missionary grammars, colonial surveys, national language academies, SIL International work, university field programs, and contemporary community-led documentation all leave traces in catalogs. The chart is therefore a map of evidence output as much as a map of human speech.
What to take away
World linguistic diversity, as seen through this Glottolog-derived extract, is geographically lumpy: Africa leads the macroarea counts at 2,363 of 8,612 records, while most language names appear once.
The citable lesson is about visibility. What scholars can count depends on where fieldwork and cataloging have been dense — and that density is itself a cultural and scientific fact.
■ END
The Fine PrintBack of the BoxEnd Credits
NoteWarningsDisclaimer
Artometrics data brief. Figures come from the sources below. Derived shares and editorial indices are not audited financials.
SourcesContentsSources
- SourceData Science Learning Community. (2025). TidyTuesday: Glottolog / language data. https://github.com/rfordatascience/tidytuesday/tree/main/data/2025/2025-12-23
- SourceHammarström, H., Forkel, R., Haspelmath, M., & Bank, S. Glottolog. Max Planck Institute for Evolutionary Anthropology. https://glottolog.org/
- SourceUNESCO. Atlas of the World's Languages in Danger. https://www.unesco.org/languages-atlas/
- SourceDryer, M. S., & Haspelmath, M. (Eds.). The World Atlas of Language Structures Online. https://wals.info/
- SourceSkirgård, H., et al. (2023). Grambank reveals the importance of genealogical constraints on linguistic diversity and highlights the impact of language loss. Science Advances, 9(16). https://doi.org/10.1126/sciadv.adg6175
- ReportFull report: artometrics.com/languages
MethodAssemblyMethod
Numbers in this issue are the published figures. The skin changes type, rules, and chart color only.
PlatesMade byImage credits
- HeroArtometrics Languages illustration.
- PlatePortrait of Luca Pacioli, attributed to Jacopo de' Barbari, c. 1495. Public domain, via Wikimedia Commons.
- PlateColor print of a toy shop, Utagawa Sadahide, 1860. The Metropolitan Museum of Art, CC0, via Wikimedia Commons.
- PlateBelasco Theatre box office, published November 1907 in Architects' and Builders' Magazine. Unknown photographer. Public domain, via Wikimedia Commons.


Updated through JUN 15, 2026.