



JUN 15, 2026 · Lego
Lego
LEGO Sets Shrank to 60 Pieces as Flagships Hit 11,695
Median part counts dropped from 142 to 59.5 as World Map and display sets pushed the complexity ceiling past 11,000 pieces.
By Kyle McAuliffe · · 4 min
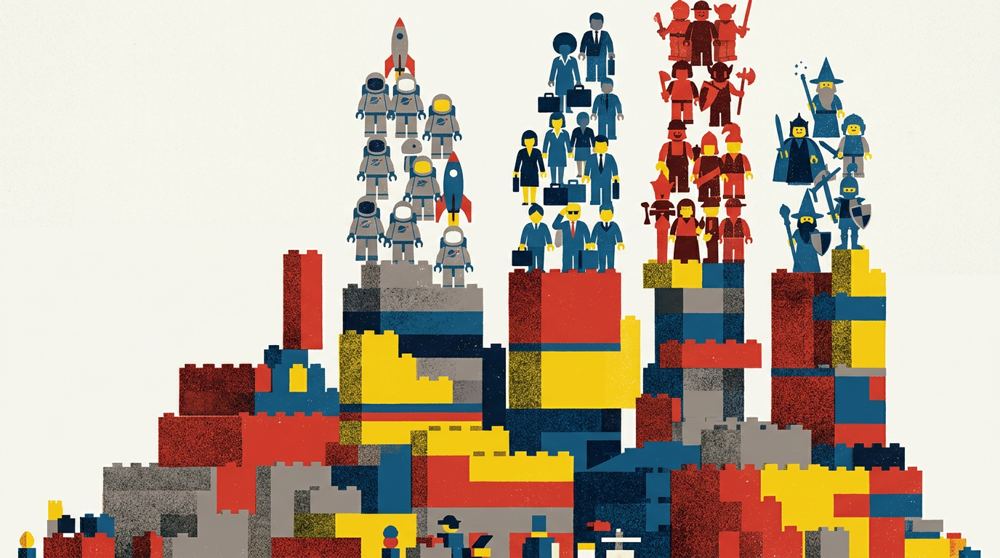
The Rebrickable dataset covering 1949–2022 shows a catalog split: median part counts fell from 142 to 59.5 while flagship builds like World Map reached 11,695 pieces. The typical set became smaller as LEGO introduced a new tier of adult display architecture.
World Map leads at 11,695 parts — the median among the top twelve is 5,792, still 170 times the file-wide median of 34. The drop in median counts does not signal declining complexity; it signals catalog segmentation. LEGO produces more small sets for everyday buyers while reserving ultra-high part counts for adult collectors willing to treat brick builds as furniture-scale architecture.
Part count is an industrial signal, not a quality measure. It tracks how much plastic inventory a box commits and how the company balances volume production against showcase releases.
11,695
World Map part count — highest in the dataset, seventeen times the top-twelve median of 5,792
59.5
Median part count by 2022 — down from 142 in the opening period despite rising flagship complexity
34
File-wide median — reveals that most sets remain small even as outliers push into five digits
How part counts changed over time
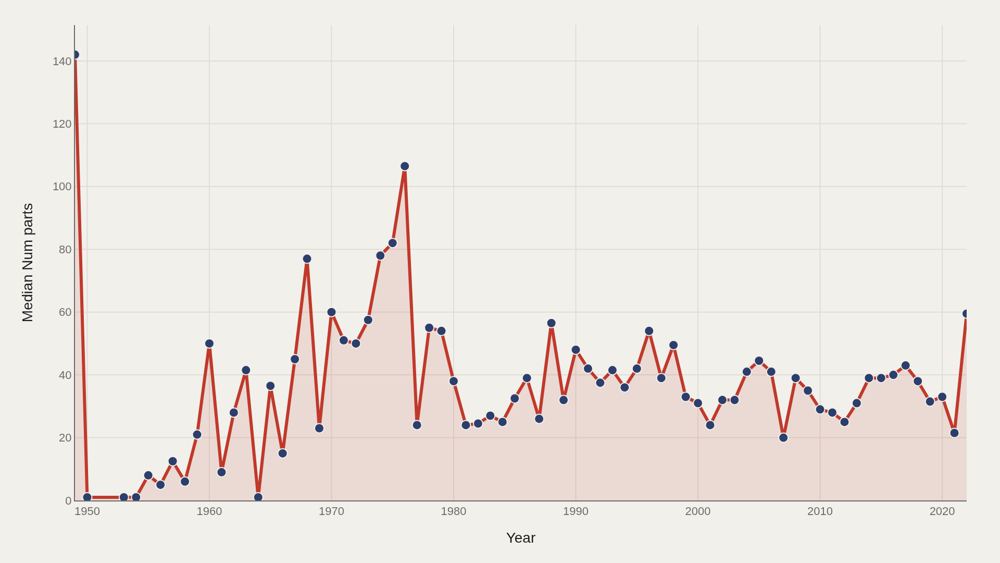
Median part counts fell from 142 in the opening period to 59.5 at the close. LEGO did not abandon complexity — the typical catalog entry became smaller even as a new class of ultra-large display sets appeared at the extreme. A falling median beside a rising ceiling is a catalog split: more small sets for everyday buyers and a thinner tier of destination builds for adults and collectors.
Who sits at the top
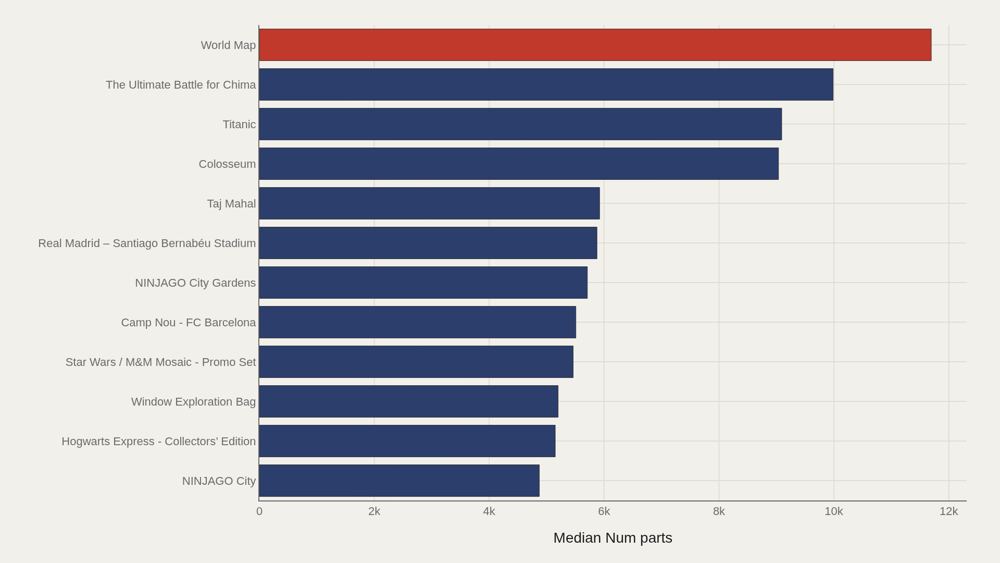
World Map leads at 11,695 parts. The median among the top dozen is 5,792 — still orders of magnitude above the file-wide median of 34. NINJAGO City, Hogwarts Express Collectors' Edition, stadium sets, Taj Mahal, Colosseum, and Titanic populate the same high-complexity band. These are not children's starter boxes. They are furniture-scale plastic architecture sold under a toy brand, and the part counts make that product shift quantitative.
How the field is spread
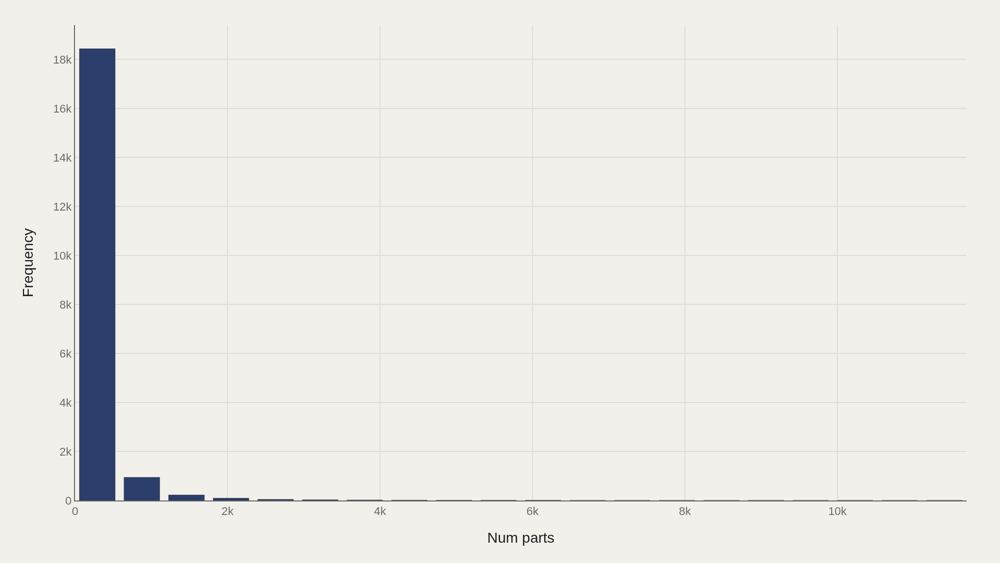
The distribution is sharply right-skewed: median 34 versus mean 161. The top decile begins near 432 parts. Most sets are modest; a long right tail carries the Instagram-era display pieces. Quoting the mean as the typical LEGO set describes a more complex object than most boxes on the shelf. The median is the honest center; the tail is the brand's adult collector strategy made visible.
Leader trends
The leading names do not move in lockstep. Some franchise icons fade as others surge; licensed themes and modular city sets take turns occupying the complexity frontier. Tracking leaders over time separates sustained flagship lines from one-off mosaic promotions. Both matter commercially; only the sustained lines reshape what LEGO means as a cultural object.
Parts and quantity
Plotting number of parts against quantity fields shows clusters that averages erase. Some rows describe unique large sets; others describe common small parts used in volume across many builds. The scatter reminds that the database mixes set-level and parts-level grains depending on the joined table. Complexity at the box level and repetition at the brick level are related industrial facts, not the same metric.
What to take away
LEGO's catalog is two products sharing one logo: a dense middle of small sets around a few dozen parts and a thin upper tier of multi-thousand-piece display builds that redefine the brand's adult market.
The citable tension is the falling median beside the extreme ceiling. Everyday LEGO became smaller in the typical case even as the largest boxes became architectural.
■ END
The Fine PrintBack of the BoxEnd Credits
NoteWarningsDisclaimer
Artometrics data brief. Figures come from the sources below. Derived shares and editorial indices are not audited financials.
SourcesContentsSources
- SourceThe source is the TidyTuesday release from 2022-09-06 (R for Data Science community). The working file contains 19,798 rows across set and parts tables after merging — set names, years, part counts, and quantity fields.
- ReportFull report: artometrics.com/legos
MethodAssemblyMethod
Numbers in this issue are the published figures. The skin changes type, rules, and chart color only.
PlatesMade byImage credits
- HeroArtometrics Lego illustration.
- PlatePortrait of Luca Pacioli, attributed to Jacopo de' Barbari, c. 1495. Public domain, via Wikimedia Commons.
- PlateColor print of a toy shop, Utagawa Sadahide, 1860. The Metropolitan Museum of Art, CC0, via Wikimedia Commons.
- PlateBelasco Theatre box office, published November 1907 in Architects' and Builders' Magazine. Unknown photographer. Public domain, via Wikimedia Commons.


Updated through JUN 15, 2026.