



JUN 15, 2026 · Longevity
Longevity
Global Life Expectancy Nearly Tripled in Five Centuries
Global median life expectancy rose from 33.9 to 73 years between 1543 and 2015, yet top countries still outlive the lowest by more than two-to-one.
By Kyle McAuliffe · · 5 min

Global median life expectancy rose from 33.9 to 73 years between 1543 and 2015 — nearly triple the opening baseline — yet countries at the top of the distribution still outlive the lowest by more than two-to-one in the same closing years.
The aggregate trend hides the most important structure: a persistent bimodal split between the long-lived and the short-lived. The median describes almost nobody's actual regime — one cluster sits at 35–45 years, another in the high-70s, with the summary statistic falling in the valley between them.
The scale: 73.3 — median life expectancy in 2015; 83.8 — the highest single observation, Hong Kong near peak; 472 years — the span from 1543 to 2015.
73.3
Median life expectancy in 2015 — nearly triple the 1543 baseline
83.8
Hong Kong's peak observation — highest single value in the dataset
33.9→73
Median lifespan rose 39.1 years from opening to closing year
500 years of survival
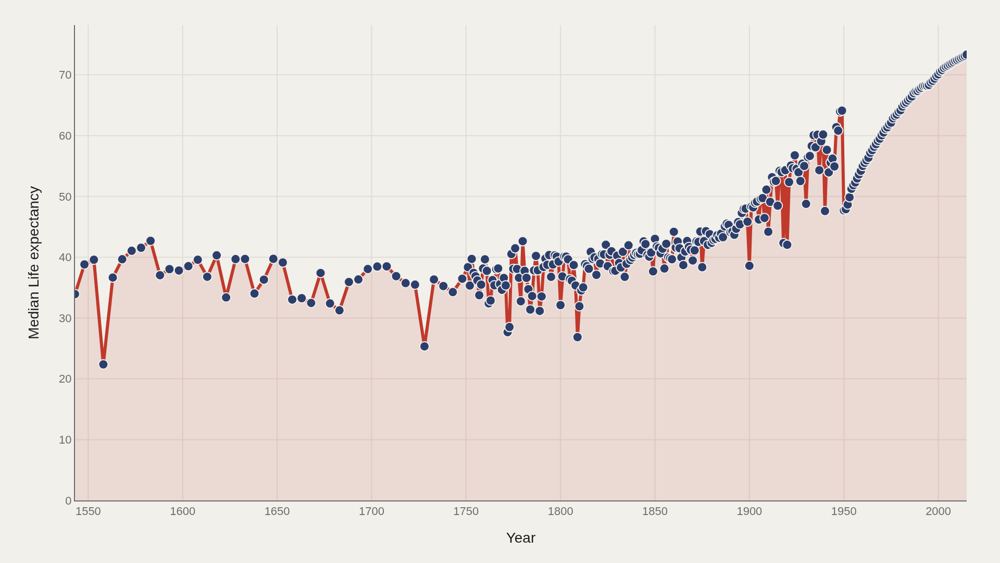
The long-run trend shows three phases: a slow, stalling climb from 1543 to roughly 1850; a steep industrial and public-health acceleration from the mid-nineteenth to mid-twentieth century; and a late-modern continuation where gains are smaller in absolute years but still real, especially where child mortality has already fallen. The curve does not plateau after 2000 — life expectancy continues rising through the final years. The median path from opening to close — 33.9→73 — is the calibration line for every country comparison that follows.
Who lives longest
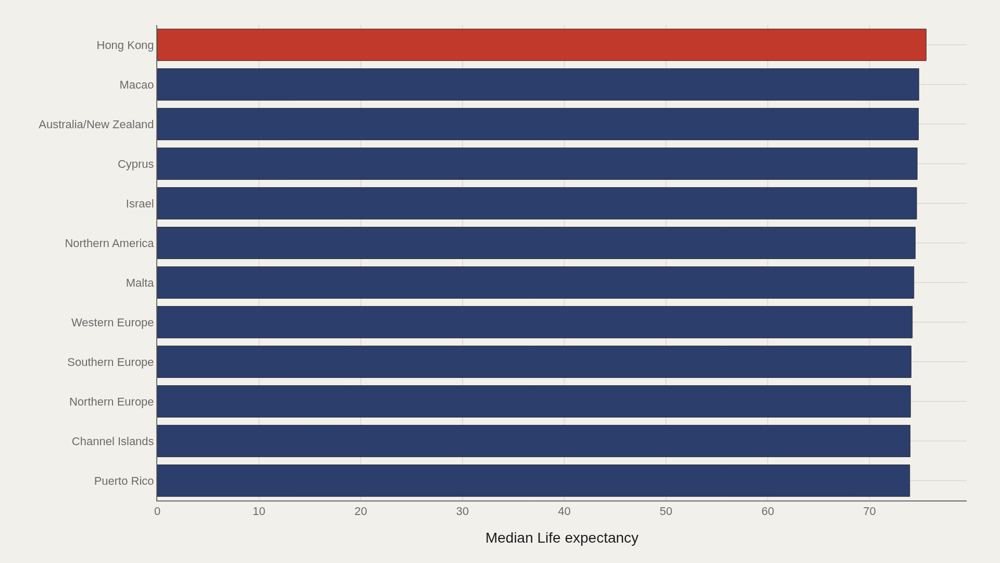
Hong Kong leads at 75.6 years averaged across the full dataset. The top dozen form a recognizable cluster: East Asian economies, Northern and Western European states, and a handful of high-income island and city systems. The gap between first (75.6) and twelfth (~73.5) is narrow. The gap between twelfth and the global median (62.4) is enormous. Longevity leadership is crowded at the top and steep underneath. Averaging across all years also favors places with long, well-documented modern series — a coverage effect that limits any ranking read as permanent hierarchy.
The split world
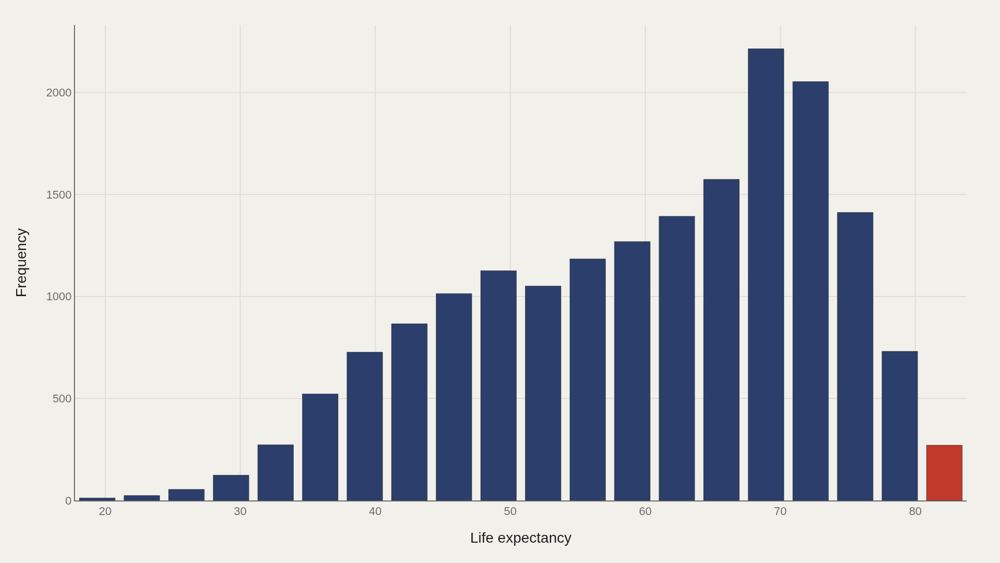
The distribution is bimodal — two peaks, not one. One cluster sits around 35–45 years, reflecting historical and lower-income observations. Another sits in the modern high-70s. The valley between them is where average life expectancy lands. The median (62.4) and mean (60.0) converge near that valley, which means the summary statistic can sound reassuring while describing almost nobody's lived regime. Bimodality proves that global longevity has been two worlds sharing one chart.
The frontrunners
The frontrunner countries do not rise together at the same rate. Japan's trajectory is among the most striking: relatively ordinary through early modern data, then a steep climb into the global lead. Iceland and Sweden present a different profile — high from the earliest modern observations, climbing steadily rather than surging. The trajectory chart shows path dependence. Places that entered the twentieth century with strong public-health foundations stayed high. Places that industrialized later sometimes closed the gap faster in absolute years, but membership of the top tier remains sticky once child survival and chronic-disease care are both in place.
Where longevity concentrates
The Pareto curve for life expectancy is shallower than you might expect from a deeply unequal dataset. The top countries account for a meaningful but not totalizing share of aggregate life-years. Longevity, unlike wealth, has a hard biological ceiling — no country can compound past the limits of human survival the way capital compounds without bound. The curve still reveals concentration of advantage. A thin set of high-income systems occupies the long end of the distribution year after year. Closing the gap is possible — the long-run median proves it — but catching the frontrunners requires repeating their public-health and living-standard package, not wishing the ceiling higher.
What to take away
The most important fact in 472 years of life expectancy data is that the trend is real. Humans have reliably extended average lifespan through sanitation, medicine, nutrition, and institutions — from a world near 30 years to a median above 73.
The second most important fact is the gap. Countries at the top of this distribution still live far longer than countries at the bottom in the same closing years. The curve shows what is possible. The spread shows what remains unfinished.
■ END
The Fine PrintBack of the BoxEnd Credits
NoteWarningsDisclaimer
Artometrics data brief. Figures come from the sources below. Derived shares and editorial indices are not audited financials.
SourcesContentsSources
- SourceData note (no linked source on the original page): Life expectancy at birth stayed between 25 and 40 years for most of recorded history because childhood mortality dominated the average, not because adults aged faster. Parish registers, …
- ReportFull report: artometrics.com/longevity
MethodAssemblyMethod
Numbers in this issue are the published figures. The skin changes type, rules, and chart color only.
PlatesMade byImage credits
- HeroArtometrics Longevity illustration.
- PlatePortrait of Luca Pacioli, attributed to Jacopo de' Barbari, c. 1495. Public domain, via Wikimedia Commons.
- PlateColor print of a toy shop, Utagawa Sadahide, 1860. The Metropolitan Museum of Art, CC0, via Wikimedia Commons.
- PlateBelasco Theatre box office, published November 1907 in Architects' and Builders' Magazine. Unknown photographer. Public domain, via Wikimedia Commons.


Updated through JUN 15, 2026.