



JUN 15, 2026 · Majors
Majors
Psychology Grads Fill Low-Wage Jobs at Four Times the Business Rate
Psychology leads 173 majors with 48,207 low-wage jobs; engineering's median is 372—a hundredfold gap in labor-market absorption.
By Kyle McAuliffe · · 4 min

Psychology graduates account for 48,207 low-wage jobs across the 173 majors in this TidyTuesday extract—nearly double the second-place total and forty times the overall median of 1,231. Engineering, the most common category label, carries a median of just 372, revealing that major choice predicts wage-floor exposure independent of unemployment.
This framing inverts the prestige narrative: the analysis leads with the count of graduates in low-wage work, then pairs it with unemployment rates. Pay ceilings matter, but so does the size of the floor.
48,207
Psychology low-wage jobs — twenty times the category median
26,912
Median among top-twelve majors — twenty-two times the overall median
372
Engineering category median — thirteen percent of humanities' 3,466
Psychology Leads Low-Wage Job Counts by a Wide Margin
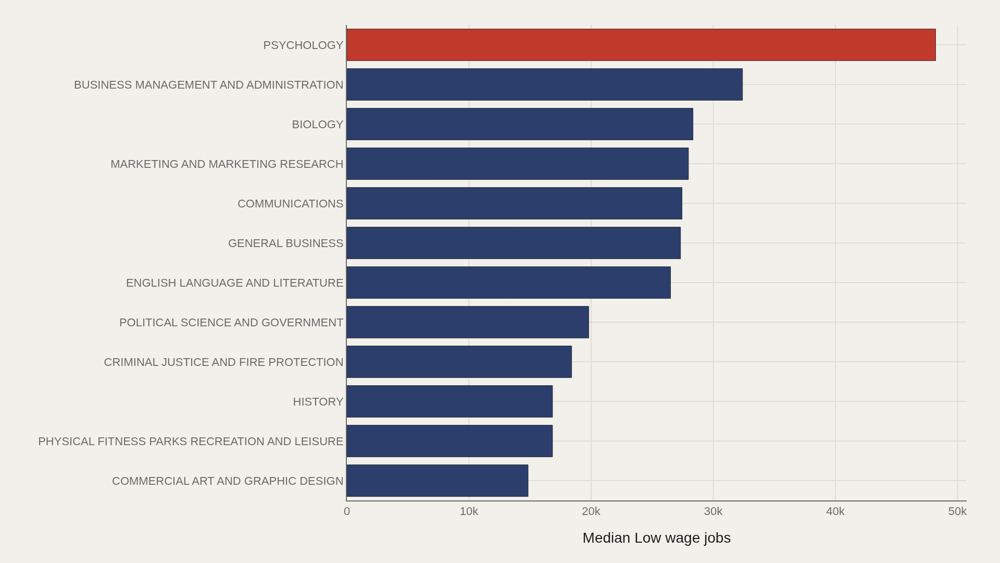
Psychology posts 48,207 low-wage jobs—ahead of Business Management and Administration (32,395), Biology (28,339), Marketing (27,968), Communications (27,440), and General Business (27,320). English Language and Literature follows at 26,503. These leaders combine large graduating cohorts with labor-market absorption into lower-wage roles. The metric is a count, not a rate—scale and risk travel together.
The Top Dozen's Median Is Still Enormous
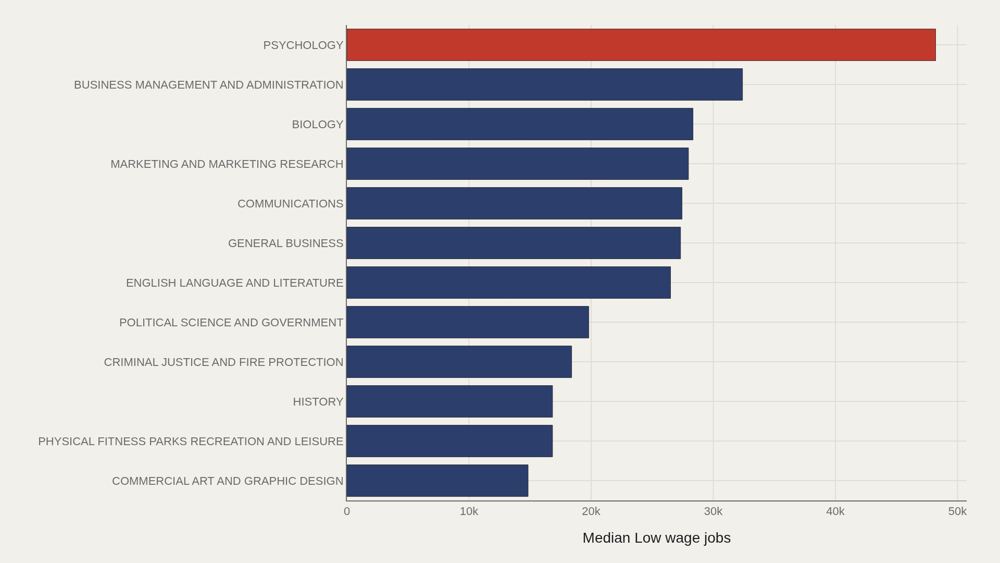
Psychology remains first at 48,207, while the median among the top dozen is 26,912—twenty-two times the overall median of 1,231. The low-wage problem in this file is concentrated in a short list of high-enrollment majors, not distributed evenly across all 173 fields.
Humanities and Business Categories Sit Higher Than Engineering
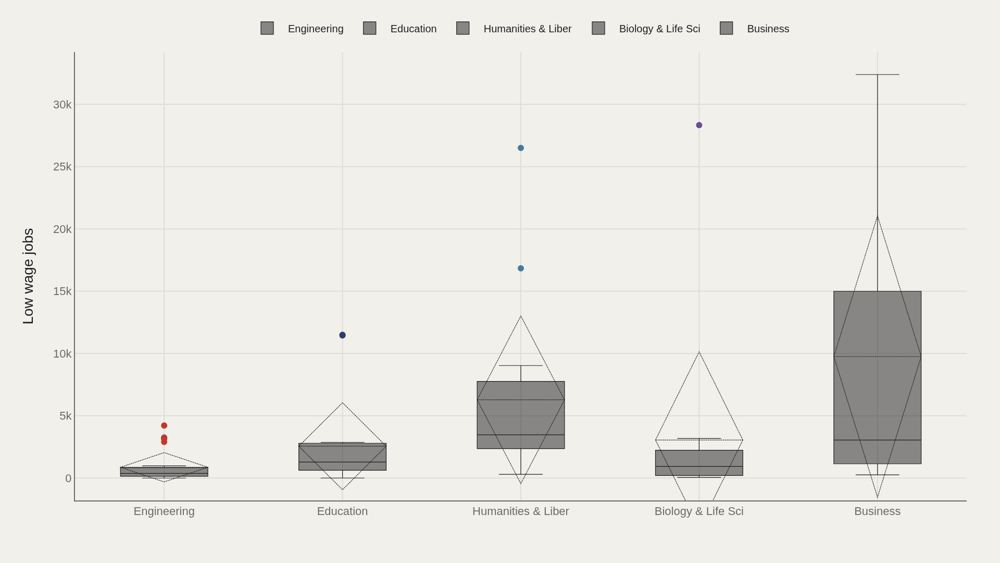
Humanities & Liberal Arts shows a median of 3,466 low-wage jobs (n=15) and Business 3,046 (n=13). Engineering's median is 372 (n=29), Education 1,282 (n=16), and Biology & Life Science 939 (n=14). Engineering's low median does not mean zero risk—its maximum still reaches into the thousands—but the center of the category is an order of magnitude below psychology's scale.
Gaps Confirm Humanities and Business Above the Median
Relative to the overall low-wage median, Humanities & Liberal Arts leads at +2,235, with Business at +1,815. Engineering, Computers & Mathematics, and Physical Sciences sit below the median by several hundred to nearly a thousand. STEM categories in this extract are not immune to low-wage outcomes, but they clear the baseline more often than large humanities and business majors.
Low-Wage Counts and Unemployment Are Different Risks
Low wage jobs versus unemployment rate spreads majors across both axes. Some fields show elevated unemployment with modest low-wage counts; others show large low-wage tallies without sitting at the top of the unemployment ranking. The scatter's warning is practical: underemployment and joblessness are related labor-market failures, but they measure different risks—and majors can fail on either axis.
What to take away
Across 173 majors, the median low-wage count is 1,231, while psychology alone exceeds 48,000. The top-dozen median of 26,912 shows how concentrated the exposure is.
Cite category gaps when comparing fields of study, and keep unemployment on a separate axis—low-wage absorption and joblessness are twin risks, not synonyms.
■ END
The Fine PrintBack of the BoxEnd Credits
NoteWarningsDisclaimer
Artometrics data brief. Figures come from the sources below. Derived shares and editorial indices are not audited financials.
SourcesContentsSources
MethodAssemblyMethod
Numbers in this issue are the published figures. The skin changes type, rules, and chart color only.
PlatesMade byImage credits
- HeroArtometrics Majors illustration.
- PlatePortrait of Luca Pacioli, attributed to Jacopo de' Barbari, c. 1495. Public domain, via Wikimedia Commons.
- PlateColor print of a toy shop, Utagawa Sadahide, 1860. The Metropolitan Museum of Art, CC0, via Wikimedia Commons.
- PlateBelasco Theatre box office, published November 1907 in Architects' and Builders' Magazine. Unknown photographer. Public domain, via Wikimedia Commons.


Updated through JUN 15, 2026.