



JUL 1, 2026 · Cities
Cities
New York Capital, San Francisco Invention
New York legitimizes and commands global systems; San Francisco prototypes them. Both export intangible power, not goods.
By Kyle McAuliffe · · 3 min

New York and San Francisco export coordination, talent, symbols, and future-facing industries — not physical goods. New York legitimizes and commands; San Francisco invents and prototypes.
The question is why they belong in the same conversation and what breaks when they are compared only by rent, taxes, or office vacancy.
Start with the scale: 2 global intangible-output cities compared across 8 identity axes.
2 cities
Both sell systems, not goods — New York commands while San Francisco invents
8 identity axes
Finance, media, software, venture, platforms, status, and talent flows scored across both cities
6 pressure narratives
Office vacancy, housing, disorder, transit, and talent churn map differently to each city's structure
Command versus Lab
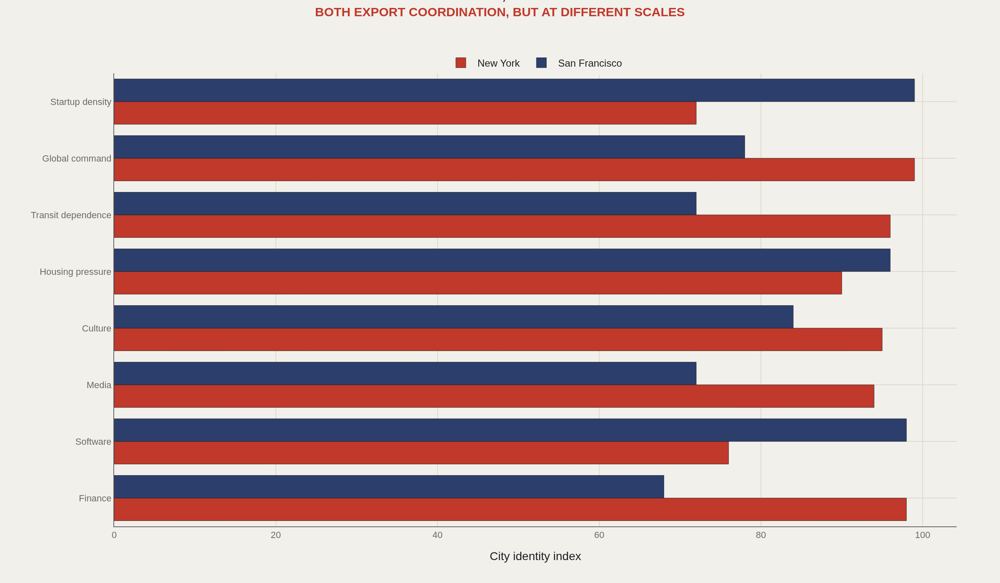
New York and San Francisco are compared because both export invisible value: finance, media, software, talent, coordination, status, and ideas. The difference is posture. New York is the command center; San Francisco is the laboratory.
History Timing
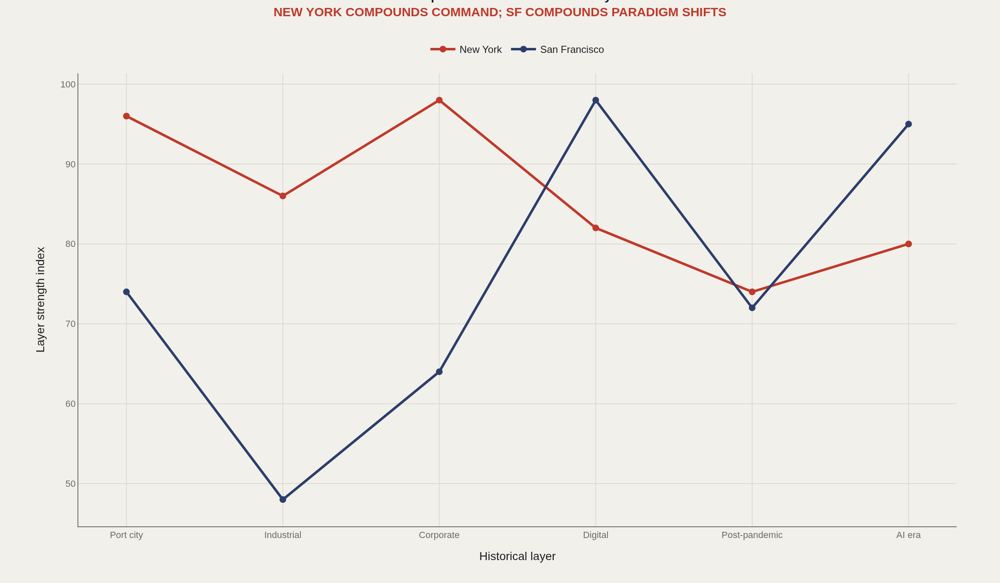
New York's power is layered and old: port, finance, media, corporate headquarters, immigration, culture. San Francisco's modern power is sharper and more episodic: software, venture capital, platforms, AI. Both cities feel globally central while operating on different clocks.
Output Fingerprint
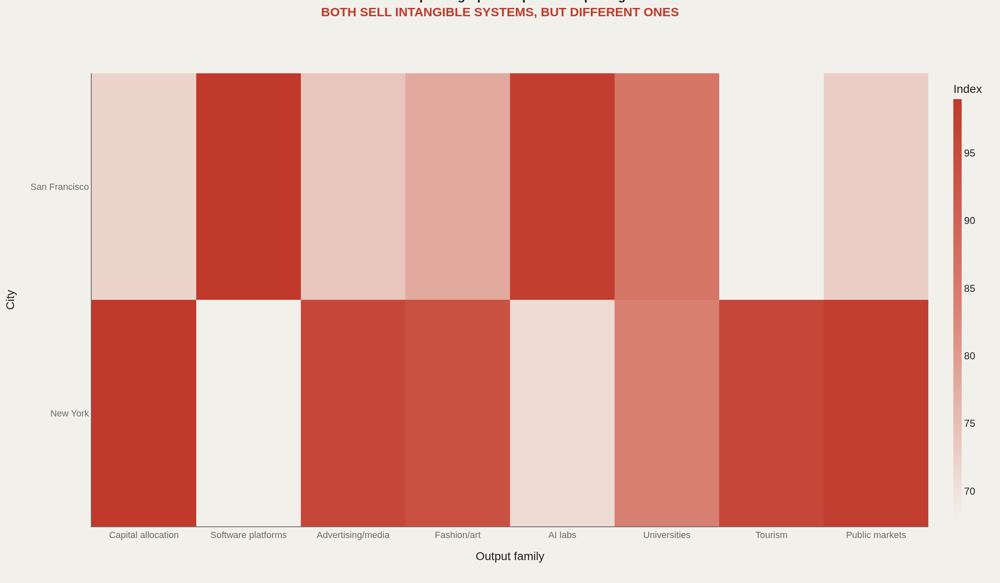
New York exports capital allocation, status, media, fashion, finance, and market legitimacy. San Francisco exports software platforms, venture risk, AI, and a cultural permission structure for invention. The pairing is valid because both cities sell coordination more than physical goods.
Pressure Pairing
Both cities face office vacancy, housing, disorder narratives, transit, and talent churn. But the same words are not the same system. New York's office reset sits inside a giant command economy. San Francisco's sits inside a smaller city whose downtown was overexposed to tech-office rhythms.
What to Ask Next
Neither city simply beats the other. The answer changes by output: capital, platforms, culture, housing, talent, or status. This gives future city reports a linked framework instead of isolated profiles.
What to take away
New York and San Francisco are comparable because both sell systems more than goods. The difference is that New York legitimizes and commands while San Francisco invents and prototypes.
The richer comparison is not which city is better, but which system each city is best at producing.
■ END
The Fine PrintBack of the BoxEnd Credits
NoteWarningsDisclaimer
Artometrics data brief. Figures come from the sources below. Derived shares and editorial indices are not audited financials.
SourcesContentsSources
- SourceBEA. Metropolitan GDP and regional industry data.
- SourceBLS metro employment data.
- SourceDataSF and NYC Open Data Socrata portals.
- SourceWorld Cities Culture Forum CREATIVE Data Framework.
- SourceTransit agency and office-market public summaries.
- ReportFull report: artometrics.com/metros
MethodAssemblyMethod
Numbers in this issue are the published figures. The skin changes type, rules, and chart color only.
PlatesMade byImage credits
- HeroArtometrics Cities illustration.
- PlatePortrait of Luca Pacioli, attributed to Jacopo de' Barbari, c. 1495. Public domain, via Wikimedia Commons.
- PlateColor print of a toy shop, Utagawa Sadahide, 1860. The Metropolitan Museum of Art, CC0, via Wikimedia Commons.
- PlateBelasco Theatre box office, published November 1907 in Architects' and Builders' Magazine. Unknown photographer. Public domain, via Wikimedia Commons.


Updated through JUL 1, 2026.