



JUN 15, 2026 · Museums
Museums
UK Cluster in Less-Deprived Areas
4,191 UK museums mapped to area deprivation: median 5.00, maximum 10.0, with South West England showing 3-point admin-area gaps.
By Kyle McAuliffe · · 4 min
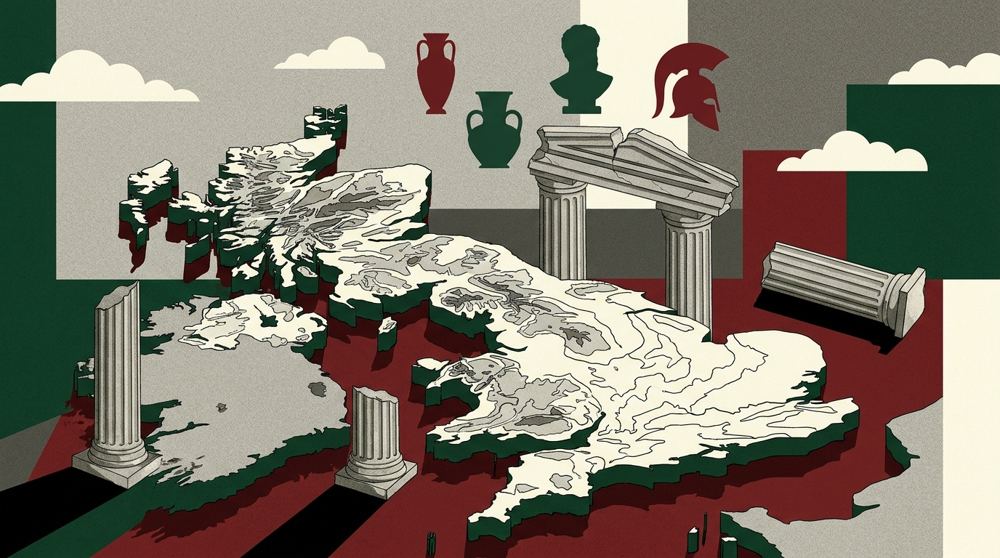
4,191 UK museums sit at a median area deprivation index of 5.00, with an observed maximum of 10.0 and a 3-point spread inside South West England alone — evidence that cultural institutions map onto place inequality in measurable, uneven patterns.
Area deprivation describes the surrounding community context, not museum quality. The question is how collections sit on that scale: whether they cluster in less-deprived bands, and how named sites and admin areas compare to the 5.00 median.
4,191
Museums in the working dataset, merged from TidyTuesday 2022-11-22 tables
5.00
Median area deprivation index, the file's geographic midpoint
10.0
Maximum observed deprivation score, shared by The Archaeology Centre and Smithy Heritage Centre
Named museums pin the top of the deprivation scale
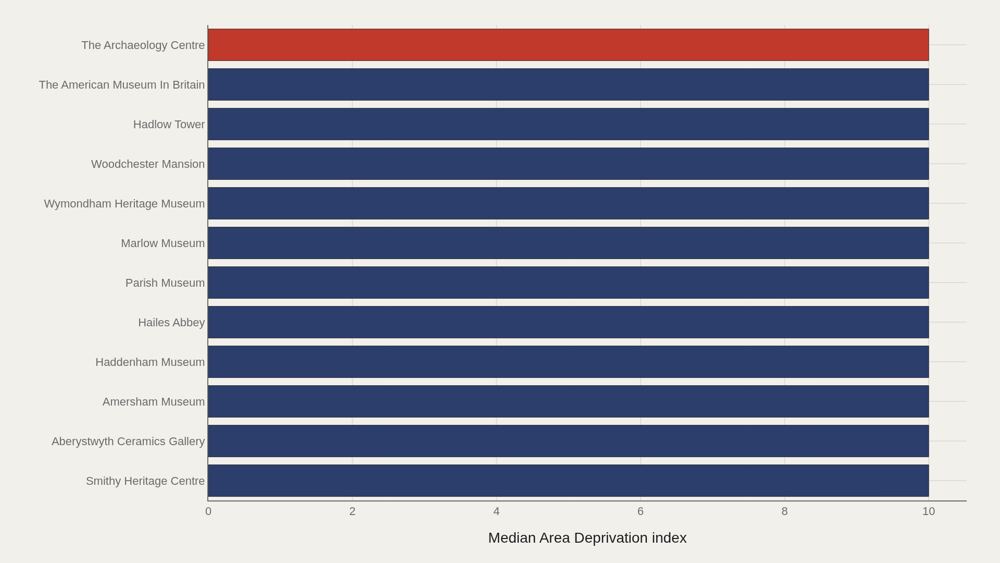
The Archaeology Centre leads at 10.0; Smithy Heritage Centre also hits 10.0. Multiple sites share the observed maximum — a reminder that the upper slice compresses when many institutions cluster at the same index band. Grouping by museum name makes individual institutions visible on the deprivation axis. This is a catalog of places, not a visitor-numbers league table.
The leaders chart sits at the index ceiling
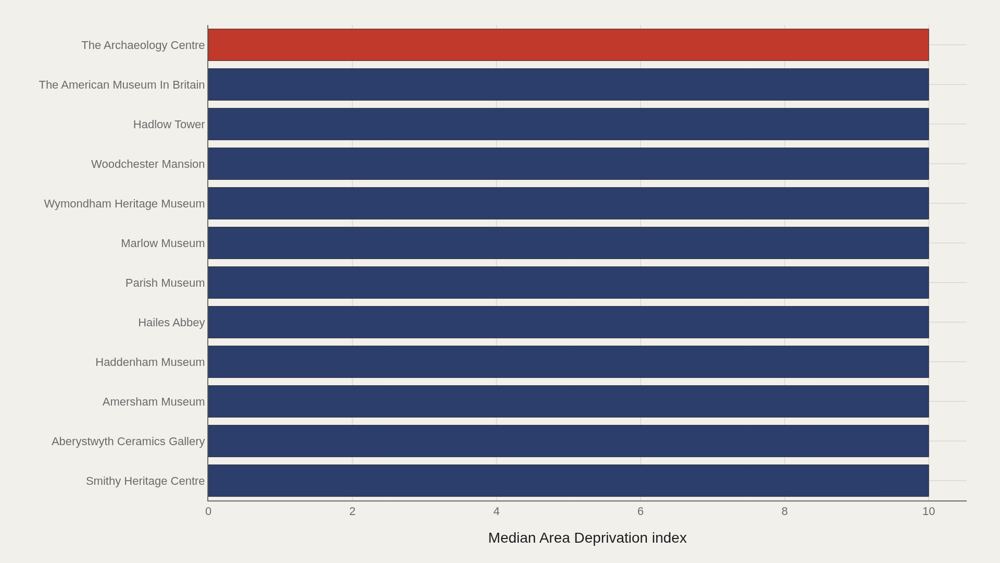
The Archaeology Centre leads at 10.0, and 10.0 marks the median among the top dozen in this cut. When the top is flat, the story is saturation at the high end of the deprivation index rather than a single runaway institution. Blenheim Palace remains a fact-box landmark; the charted leaders emphasize which names hit the 10.0 maximum in this aggregation.
Admin areas spread museums across different deprivation bands
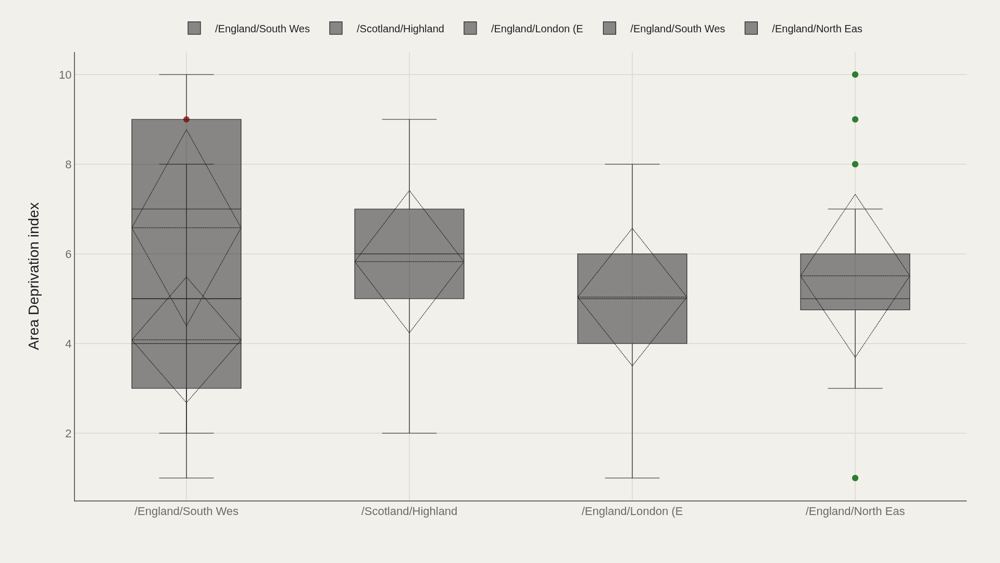
Category boxes by admin area show whether deprivation bands are shared or contested across local jurisdictions. Museums do not all sit in the same band; geography fragments the index. The spread matters: cultural infrastructure is unevenly distributed across deprivation contexts, and the boxes make the pattern visible.
Wiltshire clears the median; Cornwall trails in the South West cut
/England/South West (English Region)/Wiltshire (English UA) sits 2.00 above the median; /England/South West (English Region)/Cornwall (English UA) trails by 1.00. Even inside one English region, admin areas do not share the same offset from the file center. Signed gaps turn geography into comparable scale. They do not explain why a museum is where it is; they locate area context relative to the 5.00 median deprivation index.
Deprivation and DOMUS IDs form a joint map
Plotting area deprivation index against DOMUS identifier shows clusters a single average erases. Identifier ranges and deprivation bands co-locate in ways that matter for joining and auditing the catalog. The scatter is a data-structure check as much as a social map: it shows how the numeric deprivation field sits beside the museum identity field in the 4,191-row extract.
What to take away
UK museums in this file sit around a median deprivation index of 5.00, with an observed maximum of 10.0 and clear admin-area gaps even inside the South West. Wiltshire leads the median by 2.00; Cornwall trails by 1.00 — a 3-point spread within one region.
Name leaders, area boxes, and the deprivation–DOMUS scatter together show how cultural sites map onto inequality of place — a geography story first, a prestige story only by implication.
■ END
The Fine PrintBack of the BoxEnd Credits
NoteWarningsDisclaimer
Artometrics data brief. Figures come from the sources below. Derived shares and editorial indices are not audited financials.
SourcesContentsSources
MethodAssemblyMethod
Numbers in this issue are the published figures. The skin changes type, rules, and chart color only.
PlatesMade byImage credits
- HeroArtometrics Museums illustration.
- PlatePortrait of Luca Pacioli, attributed to Jacopo de' Barbari, c. 1495. Public domain, via Wikimedia Commons.
- PlateColor print of a toy shop, Utagawa Sadahide, 1860. The Metropolitan Museum of Art, CC0, via Wikimedia Commons.
- PlateBelasco Theatre box office, published November 1907 in Architects' and Builders' Magazine. Unknown photographer. Public domain, via Wikimedia Commons.


Updated through JUN 15, 2026.