



JUN 15, 2026 · Nuclear
Nuclear
Nuclear Test Magnitudes Peaked at 7.40 Across 2,051 Detonations
Public seismic catalogs reveal a median magnitude of 0.00—mostly missing data—while maximum recorded yields reached 7.40.
By Kyle McAuliffe · · 4 min
Public seismology catalogs of nuclear tests record 2,051 detonations with a median body-wave magnitude of 0.00—not because devices were quiet, but because most events lack filled magnitude values—and a maximum of 7.40, marking the upper tail of instrumentally detectable yields.
A TidyTuesday working extract shows the USSR leads by aggregate magnitude, WR (weapons-related) dominates purpose codes, and the year-span artifact collapses to 1970 in summary fields—read timelines as the file's available event clock, not a claim that all testing concentrated in a single year. The 7.40 maximum captures the seismically loudest events that shook global instruments; the 0.00 median reflects structural missingness, not a physics finding.
Zeros in the magnitude field mark measurement gaps, non-detections, or unfilled cells—diplomatic secrecy and uneven seismic coverage both shape what enters the public record.
2,051
Detonation records in TidyTuesday working file — most lack magnitude data
0.00
Median body-wave magnitude — reflects measurement gaps, not low-yield dominance
7.40
Maximum recorded magnitude — upper tail captures seismically loudest events
How magnitudes move through the record
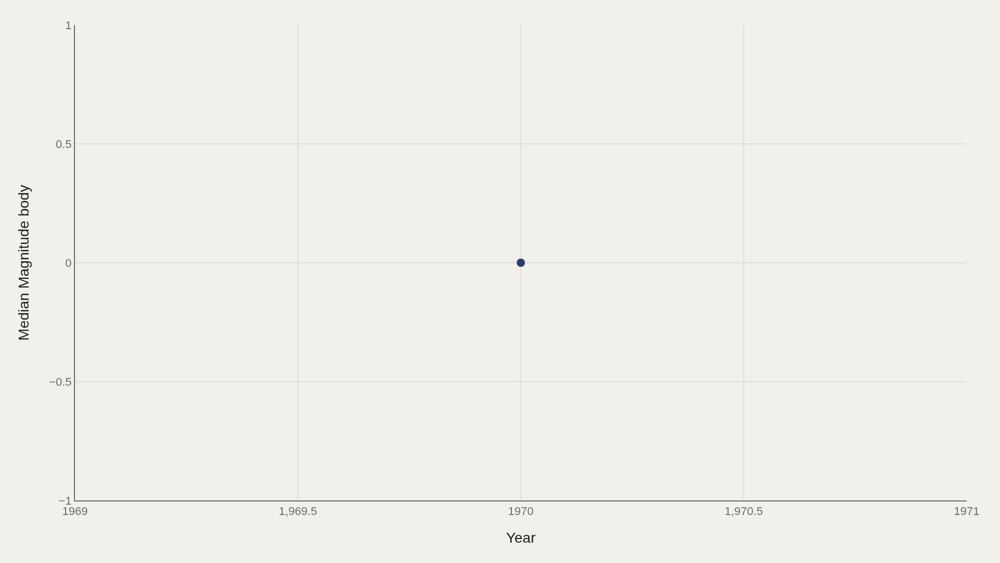
The time chart of median body-wave magnitude tracks how the typical recorded event sits across the file's date spine. Periods with denser instrumentation and more reported yields diverge from periods dominated by missing magnitude cells. The curve traces what entered the public measurement record, not a complete energy ledger of every device—diplomatic moratoria and underground testing both reshape what seismology detects.
Who sits at the top
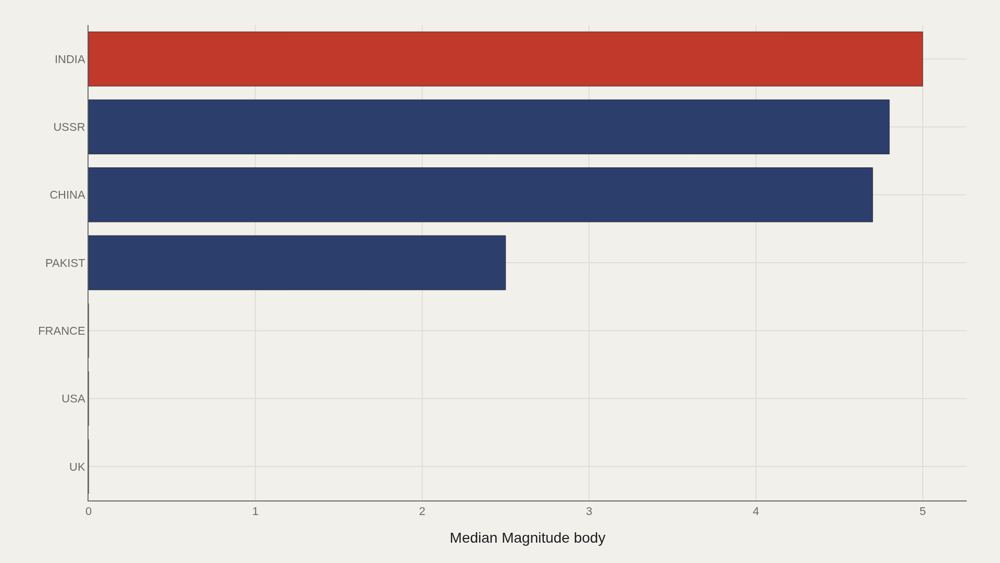
On the highlighted leader cut, INDIA leads at 5.00, with 2.50 as the median among the top dozen country entries. Related state labels in the broader ranking—USSR, China, Pakistan, France, USA, UK—confirm that the nuclear club is small and that magnitude leadership in a cleaned table reflects which events were well measured as much as which states tested most often. The USSR's fact-box lead by magnitude body and India's lead on this chart can both be true under different aggregations—always name the cut before converting a bar into a hierarchy of arsenals.
Purpose spreads magnitudes
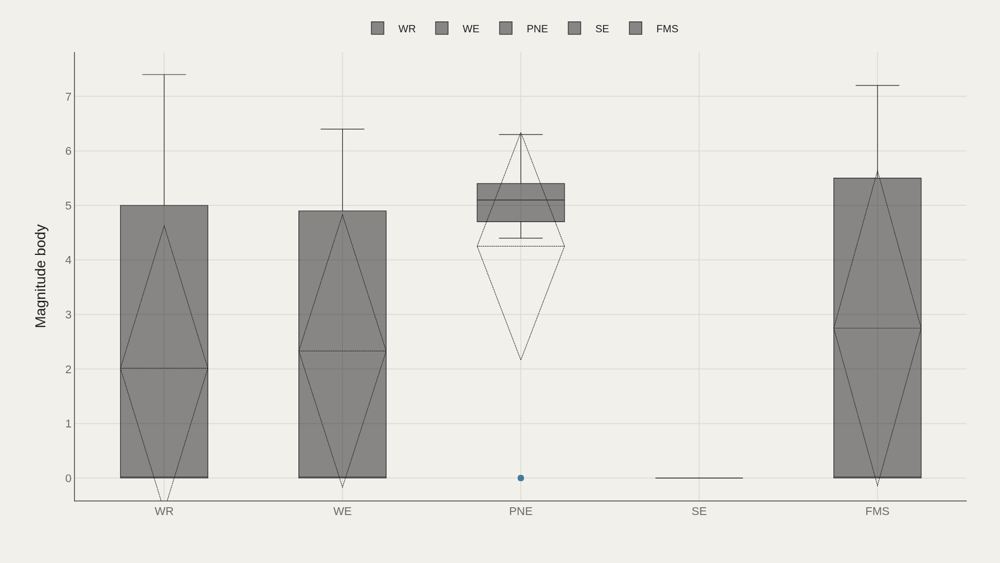
Box plots by purpose code show whether magnitude distributions are shared or contested across test categories. WR dominates headcount as the most common purpose label; other purpose codes may rank higher or lower on intensity even with fewer rows. Purpose codes encode political grammar: weapons-related tests, peaceful nuclear explosion labels, and related categories are not interchangeable events even when they share explosive physics.
Who beats the median — and who trails
The gap chart ranks purpose categories above or below the magnitude median. Categories that beat the median concentrate the instrumentally loud events; categories that trail are either genuinely smaller or more missingness-heavy. Because the file-wide median is 0.00, almost any filled magnitude will sit above the mathematical center—that is a data-structure warning as much as a physics finding.
Magnitude and depth
Plotting body-wave magnitude against depth reveals clusters that averages erase. Atmospheric and surface events occupy different depth regimes from underground tests; the scatter separates testing modes that country labels alone cannot distinguish. Depth is not a perfect proxy for political intent, but it is one of the cleanest engineering signatures in the archive—combined with magnitude, it separates theater from concealment more clearly than country labels alone.
What to take away
The nuclear test archive in this file is a skewed measurement story: 2,051 records, a median body-wave magnitude at zero because of gaps, and a thin upper tail that reaches 7.40.
A small set of states dominates the known record, and the record itself is shaped by what seismology and disclosure were willing to make countable.
■ END
The Fine PrintBack of the BoxEnd Credits
NoteWarningsDisclaimer
Artometrics data brief. Figures come from the sources below. Derived shares and editorial indices are not audited financials.
SourcesContentsSources
- SourceThe source is the TidyTuesday nuclear explosions release maintained by the R for Data Science community. The working file assembles event-level rows with country labels, purpose codes, body-wave magnitude, depth, and related fields after…
- ReportFull report: artometrics.com/nuclear
MethodAssemblyMethod
Numbers in this issue are the published figures. The skin changes type, rules, and chart color only.
PlatesMade byImage credits
- HeroArtometrics Nuclear illustration.
- PlatePortrait of Luca Pacioli, attributed to Jacopo de' Barbari, c. 1495. Public domain, via Wikimedia Commons.
- PlateColor print of a toy shop, Utagawa Sadahide, 1860. The Metropolitan Museum of Art, CC0, via Wikimedia Commons.
- PlateBelasco Theatre box office, published November 1907 in Architects' and Builders' Magazine. Unknown photographer. Public domain, via Wikimedia Commons.


Updated through JUN 15, 2026.