



OCT 11, 2026 · Padres
Padres
Record Sale, Zero Championships
San Diego solved demand and the tax bill. It has not solved October. Franchise values follow the market and the ballpark anyway.
By Kyle McAuliffe · · 5 min
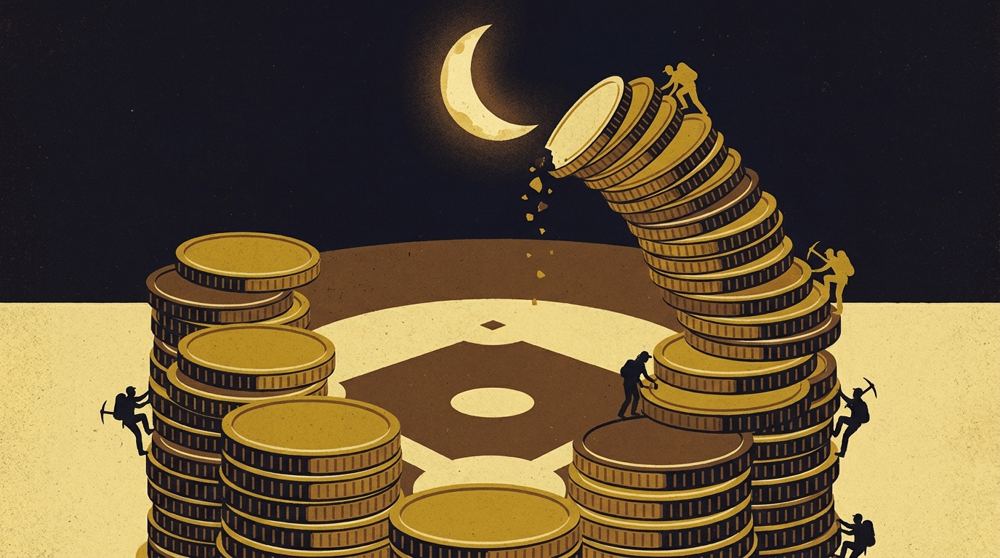
San Diego solved the two problems a mid-market club is supposed to fail. The park is full. The tax bill is paid. October is still close to a coin flip, and the franchise is on the wrong side of it. The market is paying a record price anyway. Franchise values follow the city and the building, not the trophy case.
Aug 17, 2026
owners approved the sale unanimously; José E. Feliciano is the control person
91-71
2026 record, second in the NL West; wild-card sweep of the Cubs, NLDS loss to the Brewers
Executive summary
Five findings, for an owner, a lender, or the league office.
The price of demand
The May agreement and the August vote are the same transaction seen from two desks. The family agreed to transfer control. The owners then approved it, unanimously, on a conference call on August 17, 2026. Major League Baseball's release said closing remained contingent on the weeks ahead; NBC 7 San Diego reported the new group could take operational control by the end of that week, with a press conference at Petco Park on August 24.
Fifty-eight seasons, ten Octobers
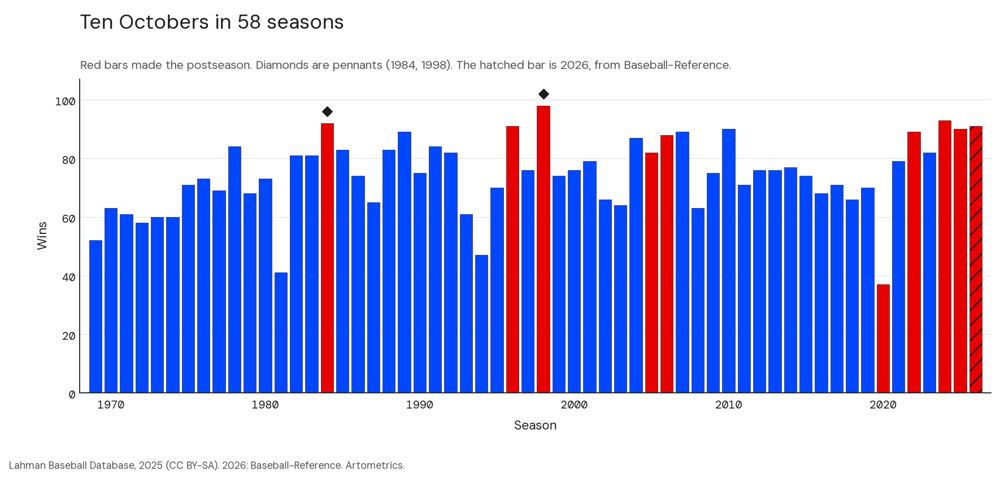
The red bars are the postseasons: 1984, 1996, 1998, 2005, 2006, 2020, 2022, 2024, 2025, and now 2026. The diamonds are the pennants. There are two of them. The hatched bar is 2026, which Lahman does not yet contain. Baseball-Reference has the club at 91–71, second in the National League West; a wild-card win over the Cubs, 2–0; and a division-series loss to Milwaukee, 3–1. The Brewers finished 103–59 in the regular season on the same site.
Demand is solved
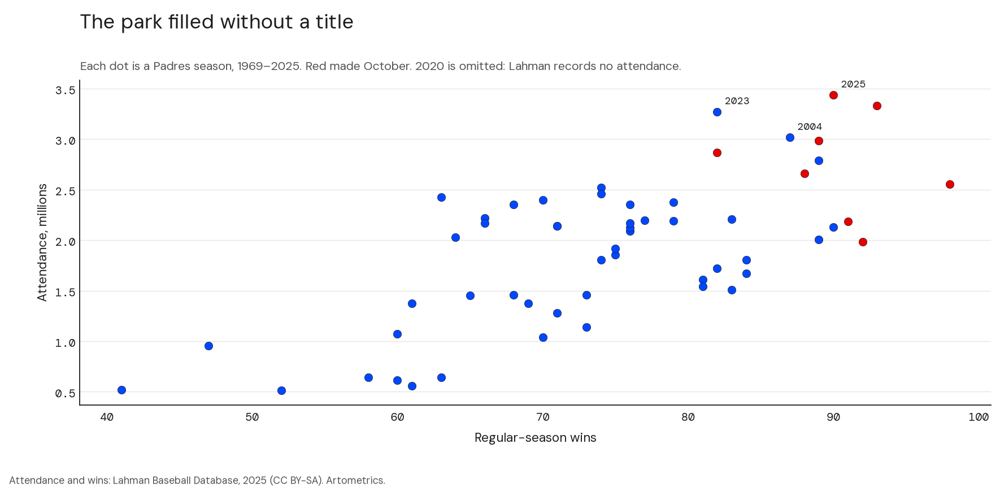
Wins and attendance do not move together. The cloud sits all over the chart. The step that matters is 2004, the first Petco Park season in the file: 3,016,752, after 2,030,084 the year before. The 2023, 2024, and 2025 seasons then set franchise records, ending at 3,437,201. Lemke, Leonard, and Tlhokwane (2010) treat attendance as a mix of team quality, weather, and promotions. San Diego's chart says the building did more work than the standings. Siegfried and Zimbalist (2000) and the later survey by Bradbury, Coates, and Humphreys (2023) are the caution on the public side of that building: stadiums rarely pay a city back. Erie, Kogan, and MacKenzie (2011) is the San Diego account of how Petco was financed. The dollar split of that deal is not reprinted here.
The Preller doctrine and the tax bill
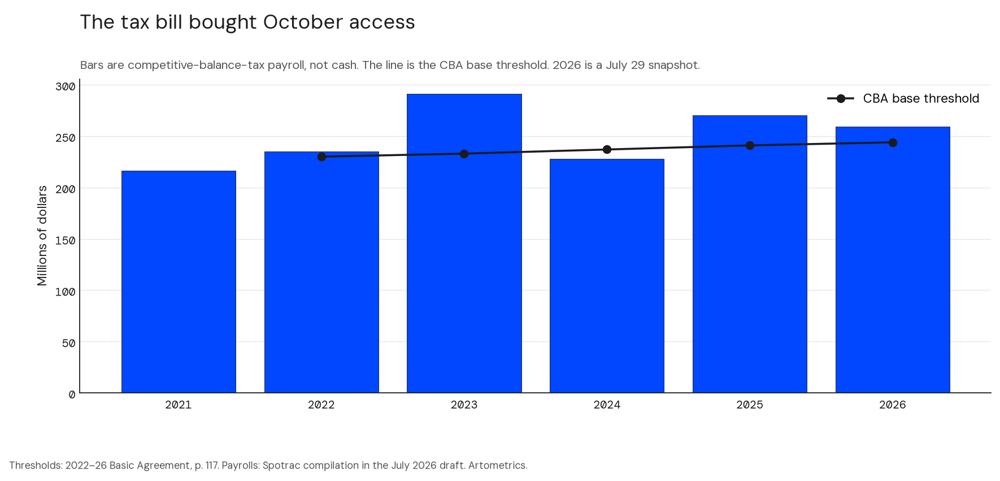
A.J. Preller has run baseball operations since 2014, and the August approval left him there. The method, as the club has practiced it, is to buy the present with the future. The pattern is the contracts on Machado, Tatis, and Bogaerts, and the 2022 trade that sent a Washington package including James Wood, MacKenzie Gore, and CJ Abrams for Juan Soto, who was then moved on. Dollar figures for those deals are not restated here. The win totals are in Lahman: 70 in 2019, 37 in the 60-game 2020 season, 79, 89, 82, 93, and 90 from 2021 through 2025. The floor rose. The pennant did not.
October is a lottery. San Diego still trails it
One hundred thirty-two, one hundred sixteen, eleven. That is the league's October from 1995 through 2025, once each series is tagged with the two clubs' regular-season winning percentages. The better club wins a little more than half the time when the percentages differ, and not more than that. Lopez, Matthews, and Baumer supply the reason to expect this. Baseball's season is long and its playoff is short. Randomness has room.
The counterexamples
The useful clubs are not the Dodgers. Los Angeles is the outspend case, and this file does not contain a 2026 Dodgers payroll. The useful clubs are the ones that did something San Diego has not.
What the buyer bought
What to watch, in order. The closing. The final 2026 tax payroll, once someone has the export. The farm list, once FanGraphs or Baseball America is on the desk, because the July "last of 30" is not repeated blind. The guarantees on the long contracts, for the same reason. And the labor negotiation, because the threshold line on the payroll chart is a rule, and the rule expires.
■ END
The Fine PrintBack of the BoxEnd Credits
NoteWarningsDisclaimer
Artometrics data brief. Figures come from the sources below. Derived shares and editorial indices are not audited financials.
SourcesContentsSources
- SourceLahman, S. (2026). Lahman's Baseball Database, 1871–2025. Society for American Baseball Research. Released January 2, 2026. CC BY-SA 3.0. sabr.org/lahman-database.
- SourceSports Reference LLC. 2026 San Diego Padres statistics. Baseball-Reference.com. teams/SDP/2026. 2025 NL Wild Card Series, Cubs over Padres (2–1). 2025_NLWC2. Tony Gwynn. Eight batting titles listed on the player page. gwynnto01.
- SourceMajor League Baseball (August 17, 2026). MLB owners unanimously approve Kwanza Jones and José E. Feliciano as new owners of the San Diego Padres. Press release.
- SourceAssociated Press (August 17, 2026). MLB approves sale of San Diego Padres to José E. Feliciano and Kwanza Jones. AP News.
- SourceNBC 7 San Diego (August 17, 2026). MLB owners approve San Diego Padres sale to group led by José E. Feliciano and Kwanza Jones ($3.9 billion; 30 percent Petco Park stake). Article.
- SourceMajor League Baseball and the Major League Baseball Players Association (2022). 2022–2026 Basic Agreement. Base tax thresholds on p. 117. PDF.
- SourceLopez, M. J., Matthews, G. J., and Baumer, B. S. (2018). How often does the best team win? The Annals of Applied Statistics, 12(4), 2483–2516. doi:10.1214/18-AOAS1165.
- SourceAlexander, D. L., and Kern, W. (2004). The economic determinants of professional sports franchise values. Journal of Sports Economics, 5(1), 51–66. doi:10.1177/1527002503251715.
- SourceHall, S., Szymanski, S., and Zimbalist, A. S. (2002). Testing causality between team performance and payroll. Journal of Sports Economics, 3(2), 149–168. doi:10.1177/152700250200300204.
- SourceRockerbie, D. W., and Easton, S. T. (2018). Revenue sharing in Major League Baseball. International Journal of Financial Studies, 6(3), 71. doi:10.3390/ijfs6030071.
- SourceRockerbie, D. W. (2020). Revenue sharing and collusive behavior in the posting system. Economies, 8(3), 71. doi:10.3390/economies8030071.
- SourceHakes, J. K., and Sauer, R. D. (2006). An economic evaluation of the Moneyball hypothesis. Journal of Economic Perspectives, 20(3), 173–185. doi:10.1257/jep.20.3.173.
- SourceSiegfried, J., and Zimbalist, A. (2000). The economics of sports facilities and their communities. Journal of Economic Perspectives, 14(3), 95–114. doi:10.1257/jep.14.3.95.
- SourceBradbury, J. C., Coates, D., and Humphreys, B. R. (2023). The impact of professional sports franchises and venues on local economies. Journal of Economic Surveys, 37(4), 1389–1431. doi:10.1111/joes.12533.
- SourceKrautmann, A. C., and Solow, J. L. (2009). The dynamics of performance over long-term contracts. Journal of Sports Economics, 10(1), 6–22. doi:10.1177/1527002508327382.
- SourceLemke, R. J., Leonard, M., and Tlhokwane, K. (2010). Estimating attendance at Major League Baseball games. Journal of Sports Economics, 11(3), 316–348. doi:10.1177/1527002509337212.
- SourceSzymanski, S. (2003). The economic design of sporting contests. Journal of Economic Literature, 41(4), 1137–1187. doi:10.1257/jel.41.4.1137.
- SourceRottenberg, S. (1956). The baseball players' labor market. Journal of Political Economy, 64(3), 242–258. doi:10.1086/257790.
- SourceChapin, T. S. (2004). Sports facilities as urban redevelopment catalysts. Journal of the American Planning Association, 70(2), 193–209. doi:10.1080/01944360408976370.
- SourceHerzog, L. A., and Sohn, C. (2019). The San Diego–Tijuana cross-border metropolis. Territory, Politics, Governance, 7(2), 177–199. doi:10.1080/21622671.2017.1323003.
- SourceKunz, W. M. (2017). The rise of the local: regional sports networks. Journal of Sports Media, 12(1), 141–168. doi:10.1353/jsm.2017.0006.
- SourceErie, S. P., Kogan, V., and MacKenzie, S. A. (2011). Paradise Plundered. Stanford University Press. doi:10.1515/9780804782180.
- SourceRelated Artometrics report: The Padres Cost $3.9 Billion. Winning Will Cost More.
- SourceRelated Artometrics report: Dodgers
- SourceRelated Artometrics report: Giants
- SourceRelated Artometrics report: Yankees
- ReportFull report: artometrics.com/padres
MethodAssemblyMethod
Numbers in this issue are the published figures. The skin changes type, rules, and chart color only.
PlatesMade byImage credits
- HeroArtometrics Padres illustration.
- PlatePortrait of Luca Pacioli, attributed to Jacopo de' Barbari, c. 1495. Public domain, via Wikimedia Commons.
- PlateColor print of a toy shop, Utagawa Sadahide, 1860. The Metropolitan Museum of Art, CC0, via Wikimedia Commons.
- PlateBelasco Theatre box office, published November 1907 in Architects' and Builders' Magazine. Unknown photographer. Public domain, via Wikimedia Commons.


Updated through OCT 11, 2026.