



JUN 15, 2026 · Parks
Parks
Golden Gate Draws 94× the Median National Park Visit
Golden Gate National Recreation Area recorded 14.6 million visits in the dataset's peak year — 94 times the system median of 155,219 across 21,560 park-year records from 1904–2016.
By Kyle McAuliffe · · 3 min

Golden Gate National Recreation Area recorded 14,554,750 annual visits at its dataset peak — 94 times the system median of 155,219 — because proximity to San Francisco matters more than wilderness purity in the visitation ledger.
A TidyTuesday working file of 21,560 park-year records spans 1904–2016. Median visits sit at 155,219; the highest single observation reaches 871,922,828. Golden Gate leads the park-name ranking, and region code IM (Intermountain) appears most frequently in the data.
Urban gateways and memorial parkways often outdraw remote wilderness. The leaderboard reflects access and metropolitan adjacency as much as scenic reputation.
21,560
Park-year records spanning 1904–2016 in the TidyTuesday dataset
155,219
Median annual visits across all park units and years
14,554,750
Golden Gate's peak annual visits, 94× the median
How visits grew over time
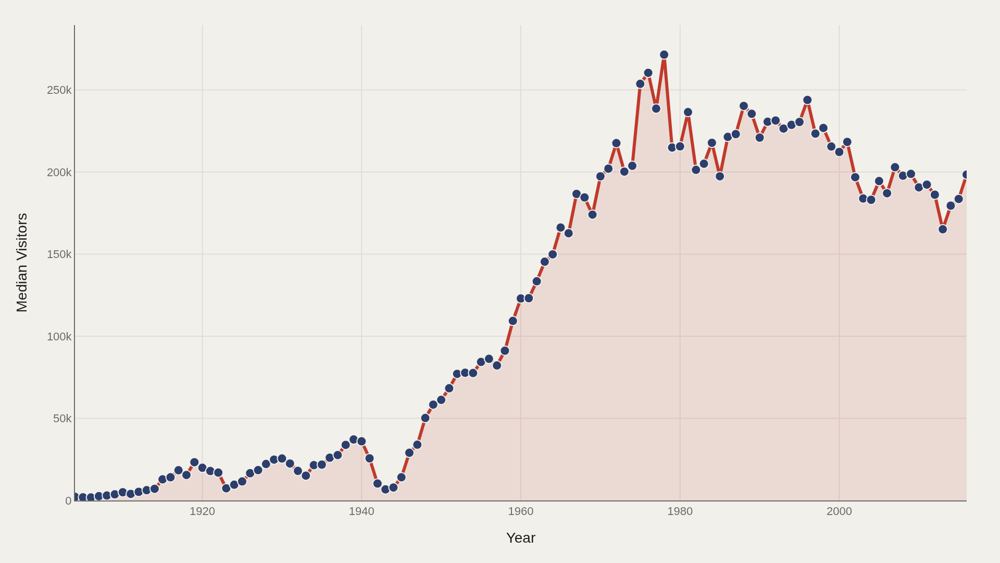
Median visitors rose from 2,200 in the opening period to 198,478 by 2016 — a 90-fold increase driven by automobile access, population growth, system expansion, and the conversion of outdoor recreation into a middle-class norm. The median's climb is the system story; the leaders are the celebrity story.
Who sits at the top
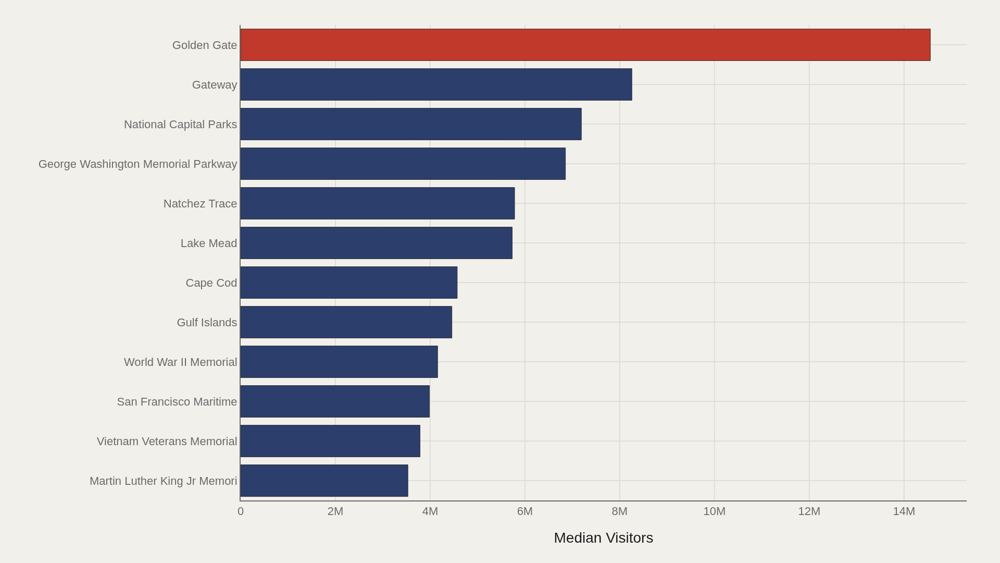
Golden Gate leads at 14,554,750 annual visits, with 5,151,270 as the median among the top dozen. Other high-traffic units include urban memorials and parkways — Vietnam Veterans Memorial, World War II Memorial, Lake Mead, Natchez Trace, Cape Cod — where recreation, commuting, and civic pilgrimage overlap. Wilderness icons still matter culturally. They do not win the raw visit count contest against metropolitan National Park Service units that function as public squares with transit access.
How regions spread visits
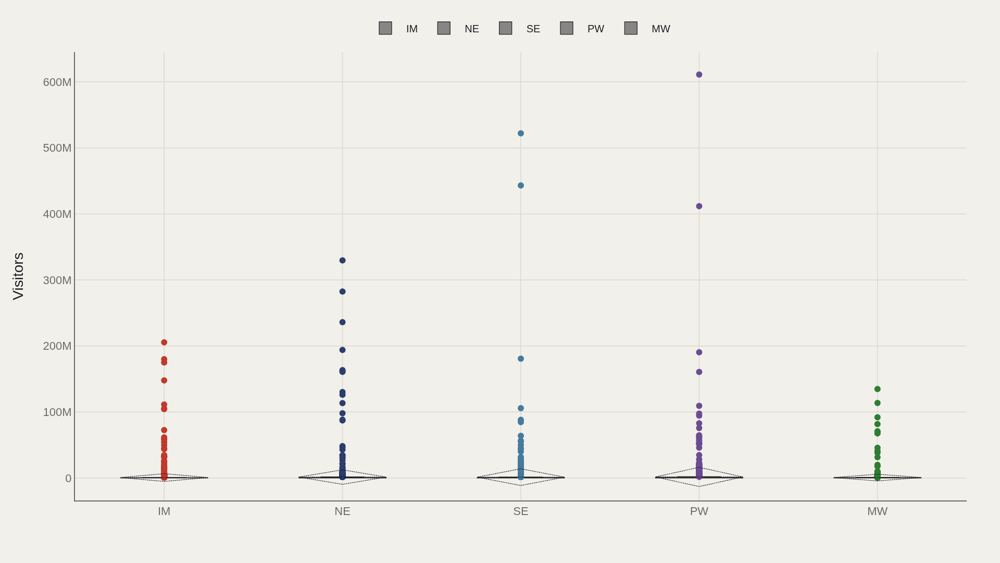
Regional box plots show whether visitor consensus is shared or contested across NPS regions. Some regions host many modest units; others host a few magnets that dominate the regional total. Spread within a region can exceed differences between region medians. A single gateway park can outdraw an entire cluster of remote units.
Who beats the median — and who trails
Region NT (National Capital) sits 12,634,481 above the median; AK (Alaska) trails by 142,104. Those gaps encode access and population gravity — Alaska's vast parklands are not built for weekend volume. The gap is a map of visitation pressure, not beauty.
Concentration of visits
The top five park-name entries account for 52% of aggregate visitors in the working file. Infrastructure stress, concession economics, and reservation politics concentrate in a short list of places — even while the agency's mission names a much longer list.
What to take away
Median park traffic rose 90-fold from 1904 to 2016, while the top five units absorbed 52% of all visits. The citable tension is access versus myth: America's most visited park units are often the ones closest to cities and memorials, not the ones on the wilderness postcard.
■ END
The Fine PrintBack of the BoxEnd Credits
NoteWarningsDisclaimer
Artometrics data brief. Figures come from the sources below. Derived shares and editorial indices are not audited financials.
SourcesContentsSources
- SourceThe source is the TidyTuesday release from 2019-09-17 (R for Data Science community). The working file contains 21,560 rows and 13 columns — park names, regions, years, and visitor totals.
- ReportFull report: artometrics.com/parks
MethodAssemblyMethod
Numbers in this issue are the published figures. The skin changes type, rules, and chart color only.
PlatesMade byImage credits
- HeroArtometrics Parks illustration.
- PlatePortrait of Luca Pacioli, attributed to Jacopo de' Barbari, c. 1495. Public domain, via Wikimedia Commons.
- PlateColor print of a toy shop, Utagawa Sadahide, 1860. The Metropolitan Museum of Art, CC0, via Wikimedia Commons.
- PlateBelasco Theatre box office, published November 1907 in Architects' and Builders' Magazine. Unknown photographer. Public domain, via Wikimedia Commons.


Updated through JUN 15, 2026.