



JUN 15, 2026 · PhDs
PhDs
Social Sciences Drove 63% of Growth
Five fields produced 63% of U.S. PhDs; social sciences led at 4,944 degrees while the median field awarded just 85.
By Kyle McAuliffe · · 4 min

Five U.S. doctorate fields produced 63% of all PhDs awarded between 2008 and 2017. Social sciences led at 4,944 degrees; the median field awarded 85. Psychology and social sciences ran 30.5 above the national median; engineering trailed by 21.5. Concentration is extreme: the typical program remains small while a handful of disciplines drive aggregate output.
The question is which disciplines grew and which stagnated when doctorate production is measured field by field, year by year. Medians prevent outlier programs from skewing every comparison.
63%
Five fields held this share of all U.S. PhDs awarded, showing extreme concentration
4,944
Social sciences led all fields, awarding this many doctorates in the period
30.5
Psychology and social sciences exceeded the national median by this margin
Median doctorate counts edged upward across the decade
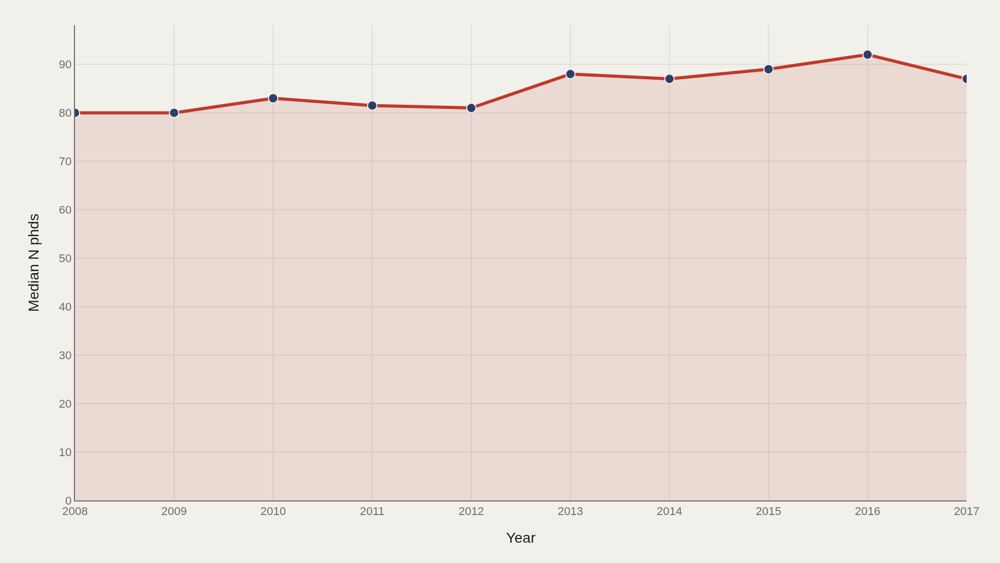
Median output rose from 80 in the opening period to 87 at the close—a modest climb around the file median of 85. The typical field-year produced slightly more doctorates by the end of the window than at the start. A rising median does not mean uniform growth. Leader fields can surge while smaller programs stall; the trend chart reports the center, not every discipline's path.
Social sciences lead the field ladder
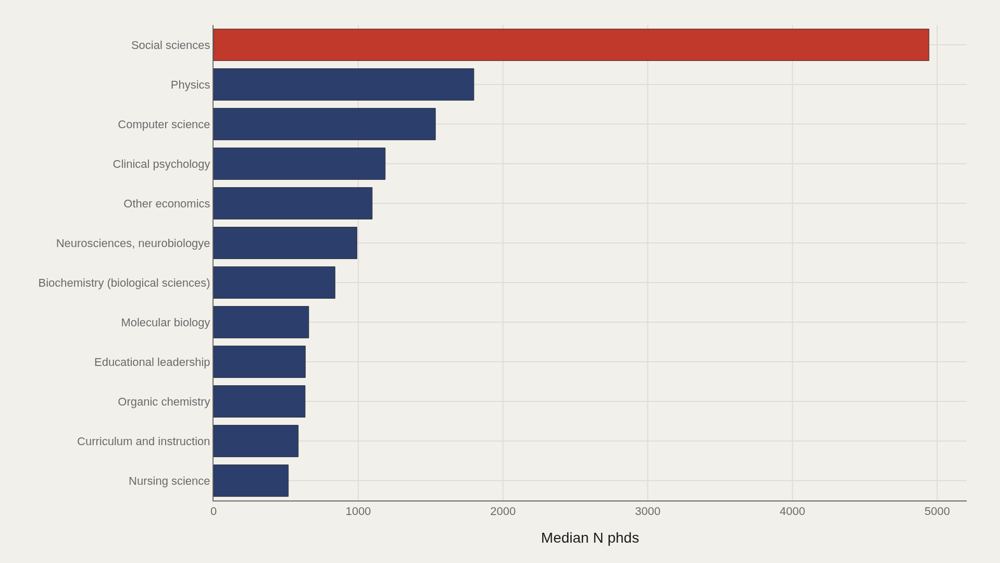
Social sciences led at 4,944 PhDs in the leaders cut, while 915 marked the median among the top dozen. The gap between first place and the top-dozen median shows how quickly the ladder drops even inside the upper tier. Life sciences appeared among the broad-field landmarks. The chart makes the numeric gap concrete.
Broad fields do not share one output band
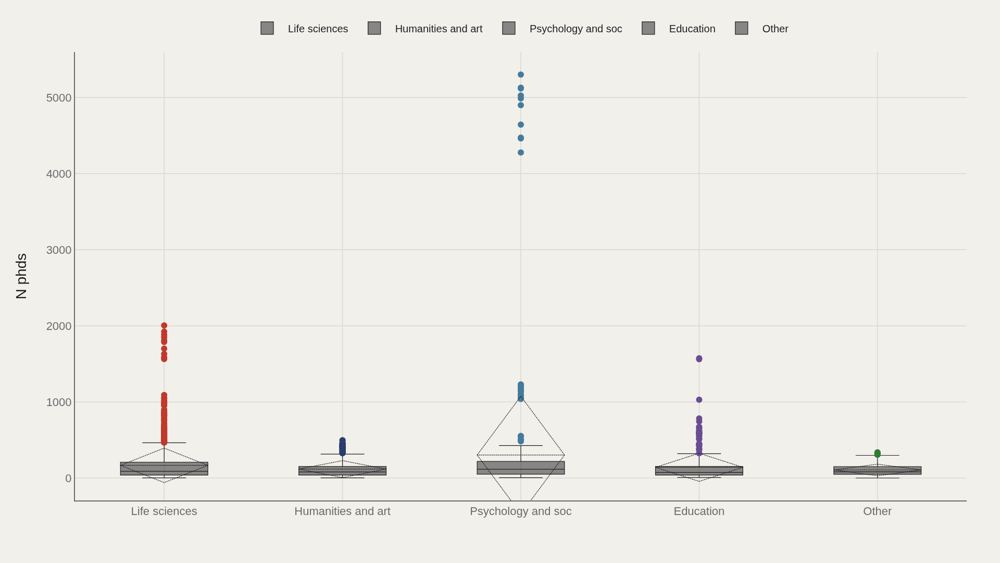
Category boxes by broad field show whether doctorate counts are shared or contested across disciplinary families. Psychology and social sciences, engineering, life sciences, and others occupy different parts of the distribution. Boxes are the right tool when fields differ in scale. A single national median of 85 hides those family-level spreads.
Psychology and social sciences clear the median; engineering trails
Psychology and social sciences sat 30.5 above the median; engineering trailed by 21.5. Those signed gaps convert broad-field boxes into distance from the file center. Trailing the median is not a quality judgment. It is a statement about relative volume in this extract's n phds metric.
Five fields hold most of the aggregate doctorates
The top five field entries accounted for 63% of aggregate n phds. Concentration is high: a small set of fields drove most of the summed doctorate output in the file. Steep Pareto curves mean capacity and attention cluster. The long tail of smaller fields still matters for the ecosystem, but it does not dominate the total.
What to take away
Doctorate output in this file centered on a median of 85, edged up from 80 to 87 over the window, and concentrated heavily: five fields held 63% of aggregate n phds.
Social sciences led the upper ladder, psychology and social sciences sat well above the median, and engineering trailed it—a volume map of disciplines, not a prestige contest.
■ END
The Fine PrintBack of the BoxEnd Credits
NoteWarningsDisclaimer
Artometrics data brief. Figures come from the sources below. Derived shares and editorial indices are not audited financials.
SourcesContentsSources
MethodAssemblyMethod
Numbers in this issue are the published figures. The skin changes type, rules, and chart color only.
PlatesMade byImage credits
- HeroArtometrics PhDs illustration.
- PlatePortrait of Luca Pacioli, attributed to Jacopo de' Barbari, c. 1495. Public domain, via Wikimedia Commons.
- PlateColor print of a toy shop, Utagawa Sadahide, 1860. The Metropolitan Museum of Art, CC0, via Wikimedia Commons.
- PlateBelasco Theatre box office, published November 1907 in Architects' and Builders' Magazine. Unknown photographer. Public domain, via Wikimedia Commons.


Updated through JUN 15, 2026.