



JUN 15, 2026 · Pizza
Pizza
Two Economies in 10,000 Menu Rows
10,000 pizza menu records show a median price floor of 0.00 and a premium tier reaching 50.0, encoding two separate markets in one dataset.
By Kyle McAuliffe · · 4 min
Pizza prices appear simple until you compare 10,000 menu rows. The Datafiniti pizza extract in TidyTuesday (released 2019-10-01) does exactly that: restaurant-level records with price-range fields revealing how "a slice" and "a specialty pie" occupy different economic tiers. The dataset contains 10,000 rows, with a median price-range minimum of 0.00 and a premium peak at 50.0.
The median price-range minimum of 0.00 signals that most listings encode missing or zero price floors rather than free pizza. The highest observed price-range minimum is 50.0, shared by Oregano and Crust Stone Oven Pizza. That ceiling marks where tasting-menu and destination pizzerias sit — a tier separated by economics and intent from the mass market below.
10,000
Records in the dataset
0.00
Median price-range minimum across all entries
50.0
Highest observed price-range minimum
Price Floors Separate Everyday Shops From Destination Pies
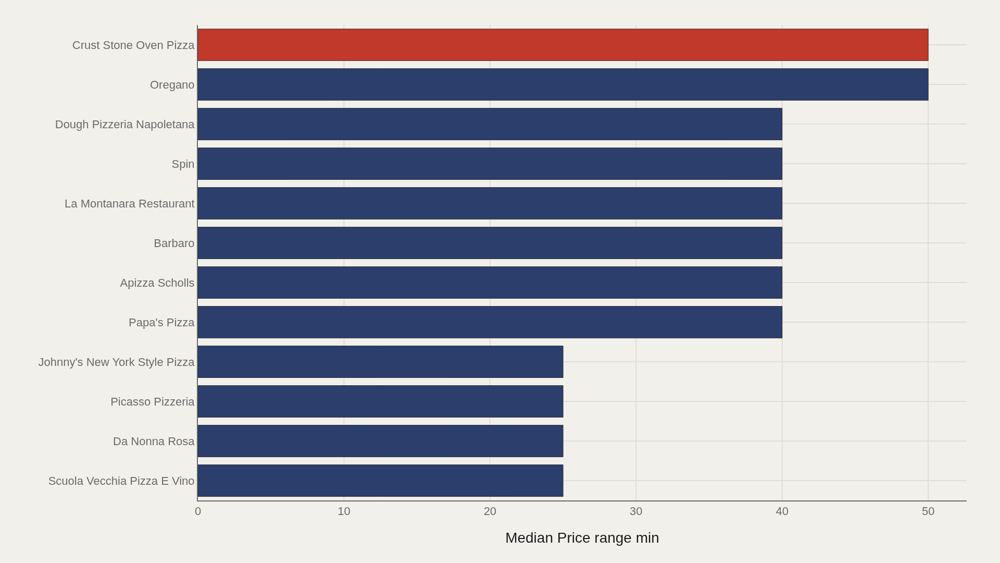
At the top of the price-range-minimum ranking, Oregano and Crust Stone Oven Pizza both reach 50.0. Just below, a cluster of shops—Papa's Pizza, Apizza Scholls, Barbaro, La Montanara, Spin, Dough Pizzeria Napoletana—sits at 40.0. These are not typical delivery-store price floors. They mark the upper edge of how this dataset encodes premium positioning. Most of the 10,000-row catalog never approaches that band.
The Top Dozen Is a Premium Plateau
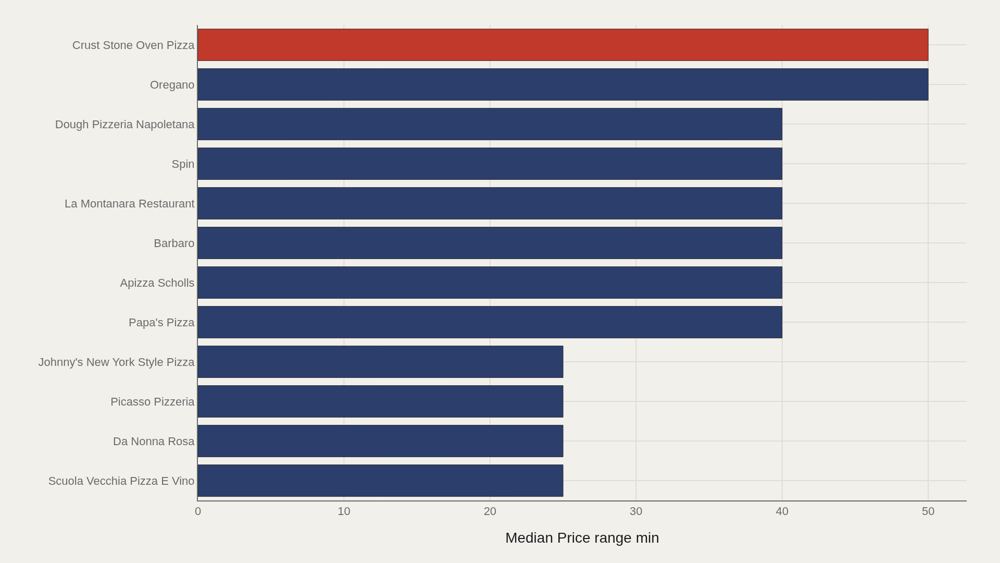
Crust Stone Oven Pizza leads at 50.0, and the median among the top dozen is 40.0. Inside the premium tier, the story is less about a single outlier than about a shared price floor. That plateau is useful for citation: when asked what "expensive pizza" looks like in this file, the answer is a top-dozen median of 40—not the global median of 0.
Almost Everything Sits in the Low Bins
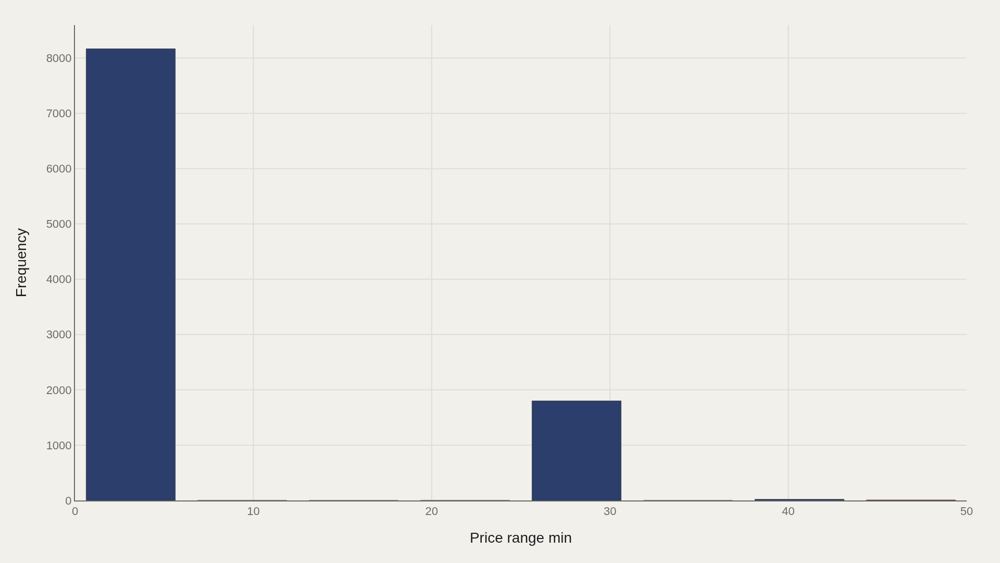
The distribution is extreme. Roughly 8,167 rows fall in the lowest price-range-minimum bin, with about 1,801 in the next populated band. Only a few dozen observations occupy the high bins near 40–50. This is why the median of 0.00 is technically correct yet narratively incomplete. The market's mass is coded at zero or missing; the cultural story lives in the thin right tail.
Premium Names Concentrate Quickly
The Pareto view of price-range minimum among leading names climbs steeply: the first five entries hold roughly 43% of the plotted aggregate, and the curve reaches the full total by the fifteenth name. Concentration here measures how high price-floor labels cluster among a short list of restaurant names, not sales volume or market share.
Minimum and Maximum Ranges Move Together — Until They Don't
Scatter points of price-range minimum against price-range maximum show the expected diagonal: shops with higher floors also list higher ceilings, with some pairs reaching from 40 up toward 55. The mismatches are instructive—low floors with wide ceilings, or compressed ranges signaling a single-price menu. Those are the places where "pizza" stops being one product and becomes a price architecture.
What to take away
In 10,000 pizza rows, the market's mass sits at a median price-range minimum of 0.00, while a thin premium tier reaches 50.0.
Cite the top-dozen median of 40 when discussing destination pizza; cite the global median when discussing typical listings. They describe different economies.
■ END
The Fine PrintBack of the BoxEnd Credits
NoteWarningsDisclaimer
Artometrics data brief. Figures come from the sources below. Derived shares and editorial indices are not audited financials.
SourcesContentsSources
MethodAssemblyMethod
Numbers in this issue are the published figures. The skin changes type, rules, and chart color only.
PlatesMade byImage credits
- HeroArtometrics Pizza illustration.
- PlatePortrait of Luca Pacioli, attributed to Jacopo de' Barbari, c. 1495. Public domain, via Wikimedia Commons.
- PlateColor print of a toy shop, Utagawa Sadahide, 1860. The Metropolitan Museum of Art, CC0, via Wikimedia Commons.
- PlateBelasco Theatre box office, published November 1907 in Architects' and Builders' Magazine. Unknown photographer. Public domain, via Wikimedia Commons.


Updated through JUN 15, 2026.