



SEP 22, 2026 · Franchises
Franchises
What Star Risk Costs an IP
Merch built Pokémon's $91B; one actor's six films show the bill.
By Kyle McAuliffe · · 5 min
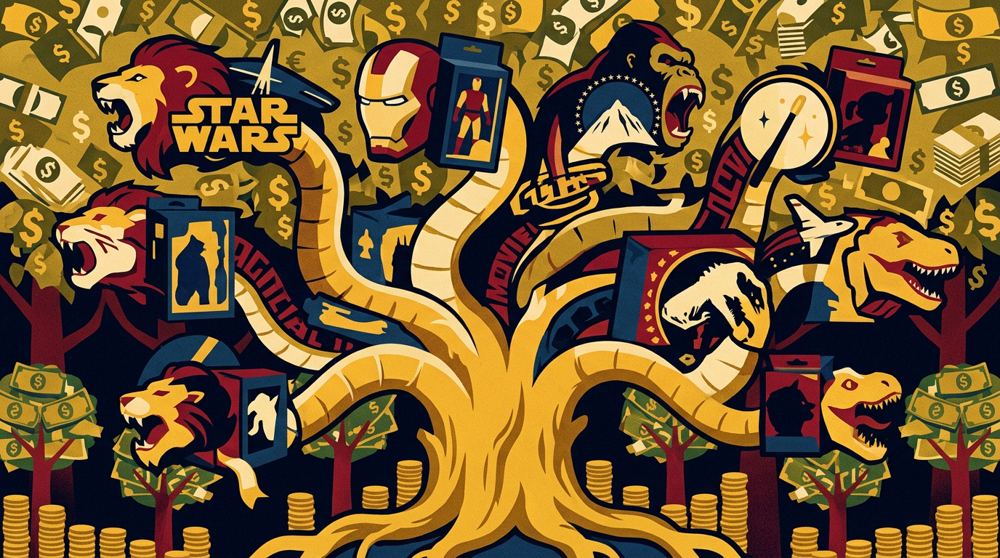
Merchandise-driven IP and star-fronted vehicles do not carry the same economic risk. The TidyTuesday 2019-07-02 media-franchise file lists 103 properties with Wikipedia lifetime revenue estimates (mid-2019); Pokémon leads at $91B, and merchandise, licensing, and retail account for 56% of row-sum revenue in the committed CSV — the same figures published in Artometrics' franchise report. When most of the money attaches to characters and products, a weak theatrical run is a line item, not an existential bet.
$90.9B
Pokémon lifetime revenue (largest single property row in the franchise file)
56%
Share of row-sum revenue from merchandise, licensing & retail (recomputed from franchise.csv)
$25,533,818
Median domestic gross across 3,401 films in the horror-tagged dataset
Merchandise Is the Insulation IP Franchises Have and Star Vehicles Don't
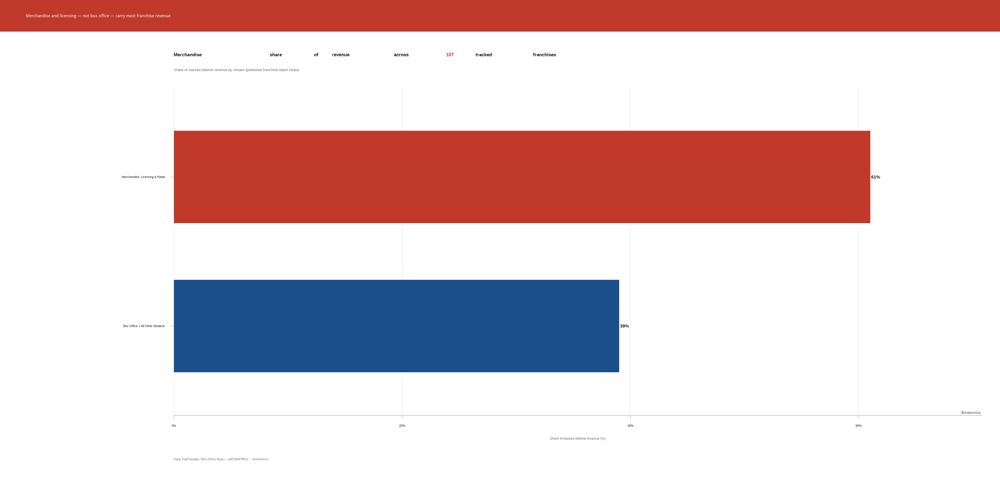
Artometrics' franchise-revenue report established that merchandise is not one revenue stream among several — it is the dominant one, at 56% of row-sum revenue across 103 franchise rows in the TidyTuesday extract (61% and a count of 107 appeared in earlier published copy). Pokémon's $91B total, the highest of any tracked property, was built almost entirely on cards, games, and retail rather than any theatrical run. Henry Jenkins's transmedia framework (Convergence Culture, NYU Press, 2006) helps explain why: revenue attached to a character or mascot can move across games, apparel, and film without routing through a single performer's weekend gross. Contrast that with a franchise or vehicle built around one performer's draw. When merchandise, licensing, and games are absent or minor, the entire revenue case rests on box office and, downstream, on home video and streaming licensing tied to that same theatrical result. There is no secondary economy running in parallel the way there is for Pokémon or, per the same report, for Star Wars — the one franchise in that dataset the report specifically flagged as fully diversified across box office, merchandise, home video, and games. A star-fronted film without that diversification is, in revenue-structure terms, closer to a single bet than to a franchise.
What Concentrated Star Risk Looks Like: A Six-Film Case Study
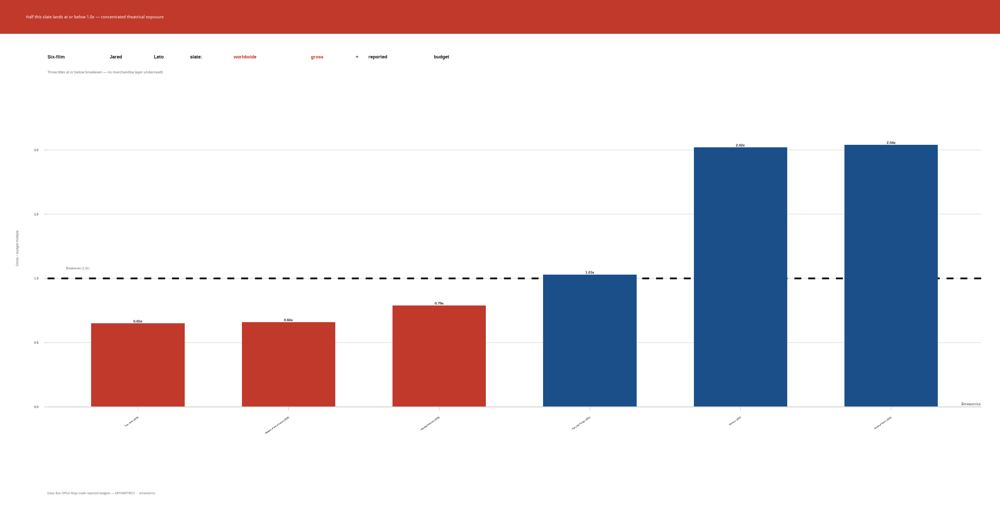
The case-study dataset is small and deliberately narrow: six of actor Jared Leto's 2020s film credits, each expressed as worldwide gross divided by reported production budget, using trade-reported budget bands from Box Office Mojo. House of Gucci (2021, ensemble) returned 2.04x on a $75M budget. Morbius (2022, lead) returned 2.02x on $83M. Those two clear breakeven with room. The other four sit closer to the line or under it: The Little Things (2021, lead, released into a pandemic-narrowed theatrical window) landed at 1.03x; Haunted Mansion (2023, ensemble) at 0.79x; Masters of the Universe (2026, supporting) at 0.66x; and Tron: Ares (2025, lead) at 0.65x, on the largest reported budget in the slate at $220M. Read individually, each figure is a data point about one film. Read as a slate, the pattern is a distribution centered near or below 1.0x rather than comfortably above it — half the titles below breakeven, and only two of six clearing 2.0x. That is the shape of concentrated star risk: revenue tied tightly to one theatrical outcome per title, with no licensing or merchandise base underneath it the way Pokémon's $91B or Star Wars' diversified mix has. When a title in this kind of slate underperforms, the studio absorbs the loss directly — there is no secondary revenue stream to blunt it. This is a small, non-random sample, and the report treats it as illustration, not proof; see Limitations below.
Conclusion
Editorial framework, not measured finding: the evidence assembled here is consistent with the idea that merchandise-driven IP carries structurally less exposure to any one person's performance than a star-fronted vehicle does. The six-film case study illustrates concentrated theatrical exposure when that cushion is absent — not proof about any particular result. De Vany and Walls (2004) show why theatrical outcomes alone behave like lottery tickets; this report asks whether merchandise share is the hedge studios buy when they want something sturdier than a lottery ticket. A future report with a larger sample could test whether merchandise share predicts how much a single underperforming title costs the studio that owns it.
■ END
The Fine PrintBack of the BoxEnd Credits
NoteWarningsDisclaimer
Artometrics data brief. Figures come from the sources below. Derived shares and editorial indices are not audited financials.
SourcesContentsSources
- SourceDe Vany, A., & Walls, W. D. (2004). Motion pictures and the risk of product market failure. Journal of Economic Perspectives, 18(3), 173–186. AEA Web
- SourceJenkins, H. (2006). Convergence Culture: Where Old and New Media Collide. NYU Press.
- SourceData Science Learning Community. (2019). TidyTuesday: Media franchise revenues. GitHub
- SourceBox Office Mojo. Title-level worldwide gross and trade-reported budget figures, 2021–2026. boxofficemojo.com
- SourceArtometrics. Franchise revenue report. artometrics.com/franchise
- SourceArtometrics. Horror-profit / margins report. artometrics.com/margins
- SourceArtometrics. The Protection Threshold. artometrics.com/protection
- ReportFull report: artometrics.com/poison
MethodAssemblyMethod
Numbers in this issue are the published figures. The skin changes type, rules, and chart color only.
PlatesMade byImage credits
- HeroArtometrics Franchises illustration.
- PlatePortrait of Luca Pacioli, attributed to Jacopo de' Barbari, c. 1495. Public domain, via Wikimedia Commons.
- PlateColor print of a toy shop, Utagawa Sadahide, 1860. The Metropolitan Museum of Art, CC0, via Wikimedia Commons.
- PlateBelasco Theatre box office, published November 1907 in Architects' and Builders' Magazine. Unknown photographer. Public domain, via Wikimedia Commons.


Updated through SEP 22, 2026.