



JUN 15, 2026 · Prisons
Prisons
U.S. Jail Populations, County by County, 1970–2016
County-level population data show regional regimes that diverge for decades, not one national curve.
By Kyle McAuliffe · · 5 min

County-level incarceration data across 1970–2016 reveal regional regimes that diverge for decades, not a single national mass-incarceration curve. The working extract holds 100,000 records; median population is 3,553, the top observation exceeds 6.8 million, and the South is the most common region label.
100,000
Records spanning 1970–2016 — coverage window includes federal war on drugs, sentencing-policy shifts, and the post-2000s plateau
3,553
Median population — typical row far below giant urban systems
6,801,437
Highest observed population — California dominates state rollup; DC leads dense-jurisdiction chart
How the pattern changed over time
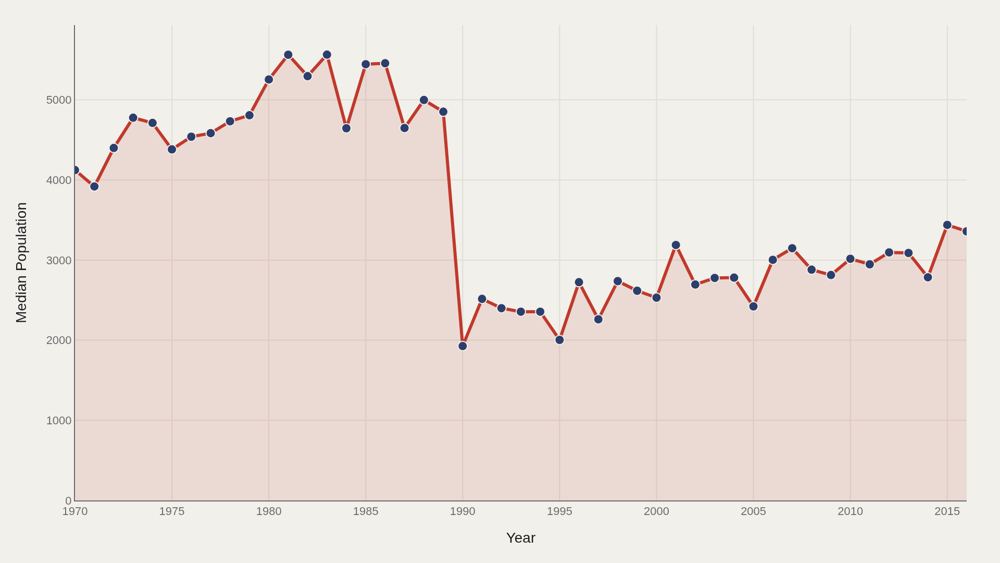
Median population in the working series falls from about 4,123 in the opening period to about 3,359 at the close. That movement can reflect changing county coverage, urban-rural composition, and how incomplete early rows enter the sample — not a simple story that places got smaller. The time chart forces the rest of the analysis to admit that the typical row in 1970 and the typical row in 2016 are not drawn from identical geographic mixes. Because this file is row-based, the median population line is partly a coverage diagnostic. A county with a small jail, a large urban system, and a state-level aggregate can coexist in the same extract if the source tables carry them forward. The trend line therefore tells readers how the analytic unit changes over time before it tells them anything about punishment intensity.
Who sits at the top
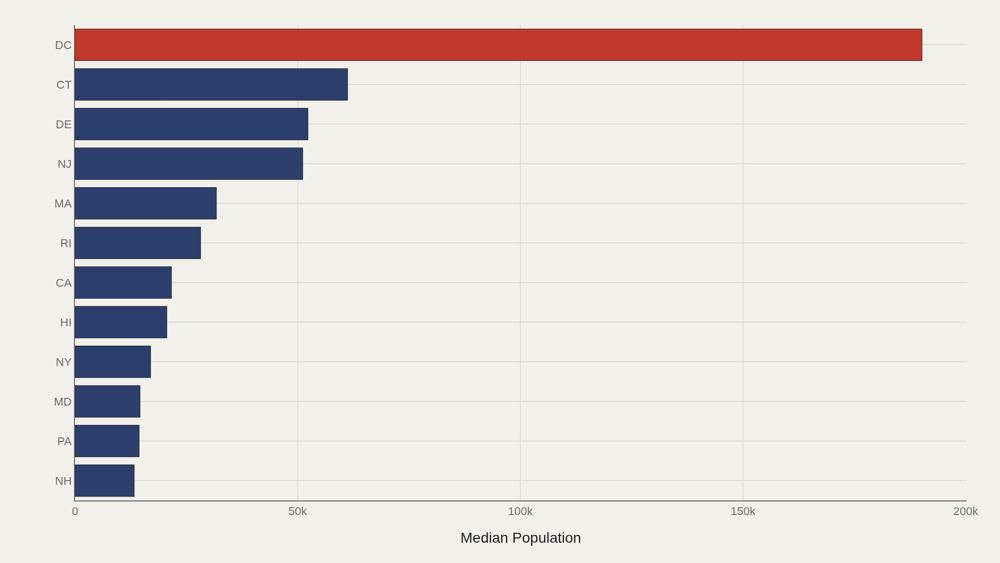
On the leader cut highlighted in the file, DC leads at 190,209, with 24,944 as the median among the top dozen. Dense jurisdictions and large states occupy the same head for different reasons — capital-city concentration versus sheer statewide population. California's fact-box lead on state population and DC's lead on this chart can both be true. They answer different aggregation questions. Confusing them produces false arguments about which place is most incarcerated rather than which place is largest or densest in the extract. The District of Columbia is a warning case because it is not a state, not an ordinary county, and not a simple municipal equivalent. Its criminal-justice system has long involved federal oversight, local jail custody, and post-sentencing arrangements that differ from state prison systems. A high DC entry in a population leader chart should trigger questions about geography and institutional definition before it triggers a national ranking claim. California's presence in the state rollup points to a different scale issue. Los Angeles County, the California Department of Corrections and Rehabilitation, and statewide demographic size all shape the visibility of California in criminal-justice data. Large population does not automatically mean high rate; it means the denominator and administrative footprint are large enough to dominate many raw-count charts.
How regions spread
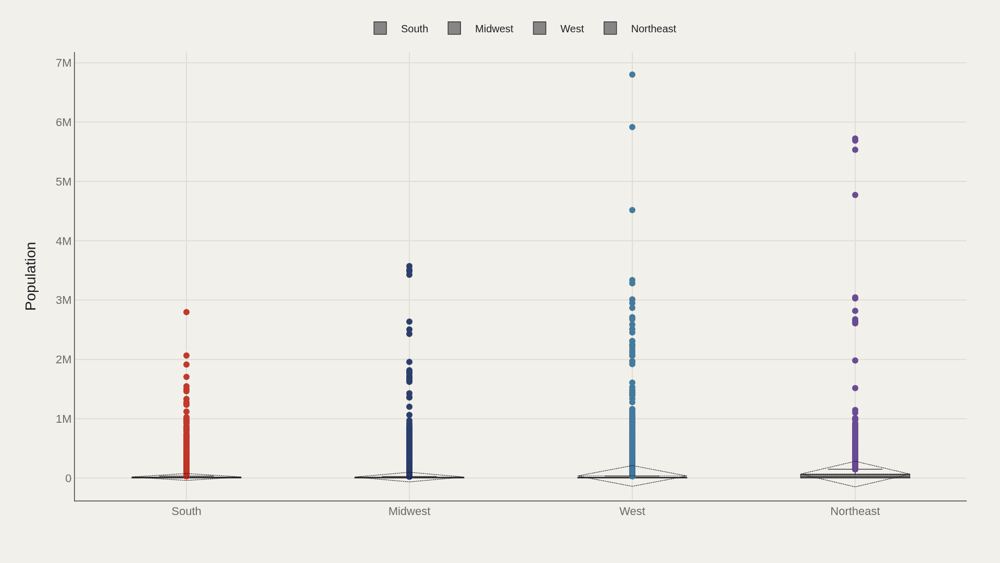
Regional box plots show whether population consensus is shared or contested across the South, Northeast, Midwest, and West. The South's frequency as the most common region label does not automatically mean it has the highest median population per row. Spread within regions often exceeds spread between region medians. County inequality inside a region is part of the incarceration story, not noise around a regional average. The regional labels matter because U.S. criminal justice is federal in vocabulary but local in operation. Sheriffs, county commissioners, state legislatures, prosecutors, bail rules, jail financing, and prison siting vary sharply across the South, Northeast, Midwest, and West. The South's high row frequency in the file is consistent with its large county count and centrality in incarceration scholarship, but it is not itself proof of a higher imprisonment rate. Within-region spread is where the policy story begins. A rural Southern county, Harris County in Texas, Cook County in Illinois, and New York City's jail system do not share the same scale or pretrial process simply because they fit under regional labels. Box plots protect that variation from being erased by a single national average.
What to take away
Incarceration trends in this extract are a story of divergent geographies sharing one national vocabulary. Median rows sit near 3,553 people; extremes exceed millions; regional gaps reach five figures above the median.
■ END
The Fine PrintBack of the BoxEnd Credits
NoteWarningsDisclaimer
Artometrics data brief. Figures come from the sources below. Derived shares and editorial indices are not audited financials.
SourcesContentsSources
- SourceData Science Learning Community. (2019). TidyTuesday: Incarceration Trends. https://github.com/rfordatascience/tidytuesday/tree/main/data/2019/2019-01-22
- SourceBureau of Justice Statistics. Correctional Populations in the United States. https://bjs.ojp.gov/library/publications/list?series_filter=Correctional%20Populations%20in%20the%20United%20States
- SourceNational Research Council. (2014). The Growth of Incarceration in the United States: Exploring Causes and Consequences. https://doi.org/10.17226/18613
- SourceVera Institute of Justice. Incarceration Trends. https://trends.vera.org/
- ReportFull report: artometrics.com/prisons
MethodAssemblyMethod
Numbers in this issue are the published figures. The skin changes type, rules, and chart color only.
PlatesMade byImage credits
- HeroArtometrics Prisons illustration.
- PlatePortrait of Luca Pacioli, attributed to Jacopo de' Barbari, c. 1495. Public domain, via Wikimedia Commons.
- PlateColor print of a toy shop, Utagawa Sadahide, 1860. The Metropolitan Museum of Art, CC0, via Wikimedia Commons.
- PlateBelasco Theatre box office, published November 1907 in Architects' and Builders' Magazine. Unknown photographer. Public domain, via Wikimedia Commons.


Updated through JUN 15, 2026.