



JUN 15, 2026 · Billboard
Billboard
How the Top of the Hot 100 Slowed Down, Then Sped Up Again
Distinct songs in the Hot 100 top 10 peaked at 130 in 1966 and 124 in 1989, fell to 77 in 1992 and 55 in 2015, then reached 92 in 2022.
By Kyle McAuliffe · · 4 min
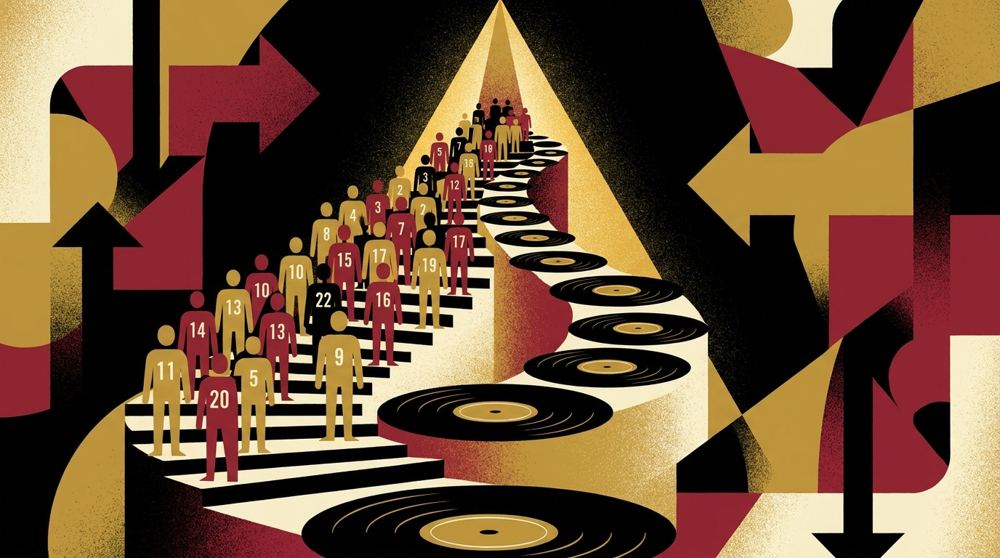
The Billboard Hot 100 is a weekly ranking machine: 100 positions, endlessly refreshed. The TidyTuesday billboard extract used here holds 100,000 song-week rows, with a median week position of 50.0 — exactly mid-chart — and a highest observed week position of 100 (the bottom rung).
That median of 50 is almost tautological in a full 1–100 ranking, which is why the interesting questions shift to concentration, re-entries (instance), and which titles spend time at the chart’s edges. “Down By The River” appears among the fact-box leaders for week position in this working file.
100,000
Records in the working dataset
50.0
Median Week position
100
Highest observed Week position
Song-Level Position Averages Crowd the Bottom Rung
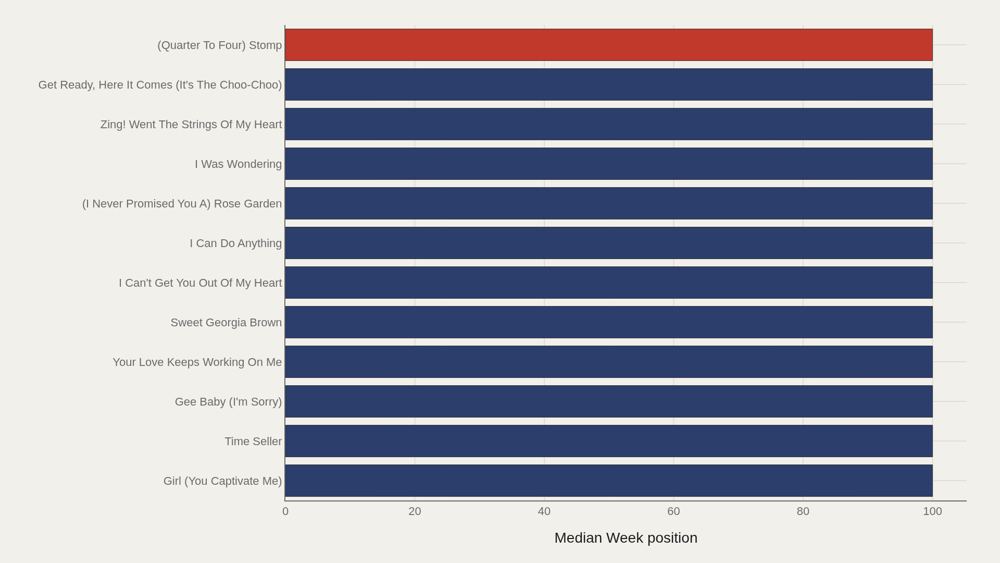
When songs are ranked by week-position summaries, a block of titles ties at 100 — including Girl (You Captivate Me), Time Seller, Gee Baby (I’m Sorry), and others. Those are songs whose observed positions in this aggregation sit at the chart floor. The chart is less a hall of fame than a map of how many titles live at the margins of the Hot 100’s attention economy.
Leaders by Week Position Are a Flat Elite
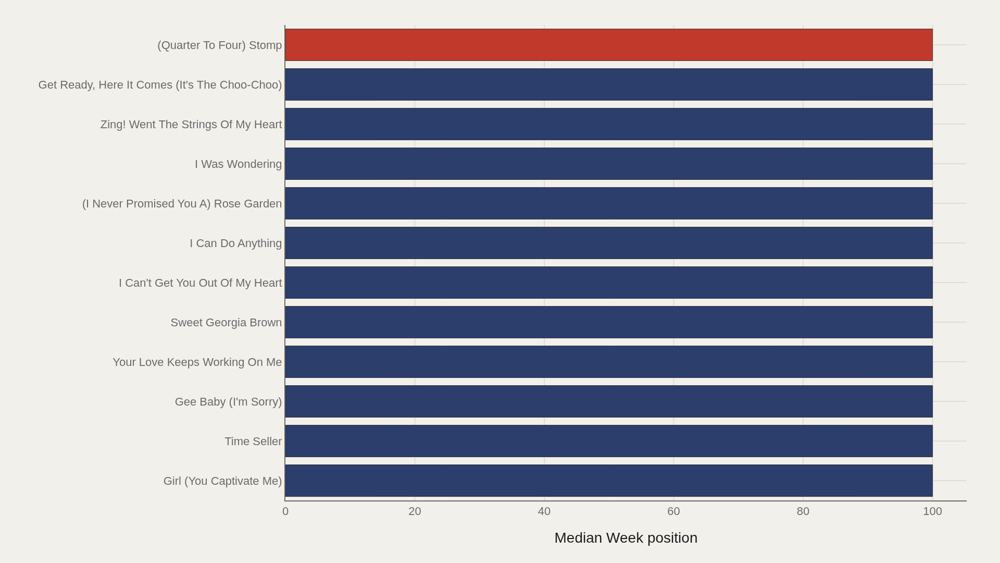
(Quarter To Four) Stomp and peer titles in the leaders view hit 100, and the median among the top dozen is also 100. There is no graded ladder here — the “leaders” by this numeric field are a plateau at the bottom rank. That flatness is informative: many songs brush the Hot 100 without climbing. Presence is not the same as dominance.
Weekly Positions Fill the Chart Almost Uniformly
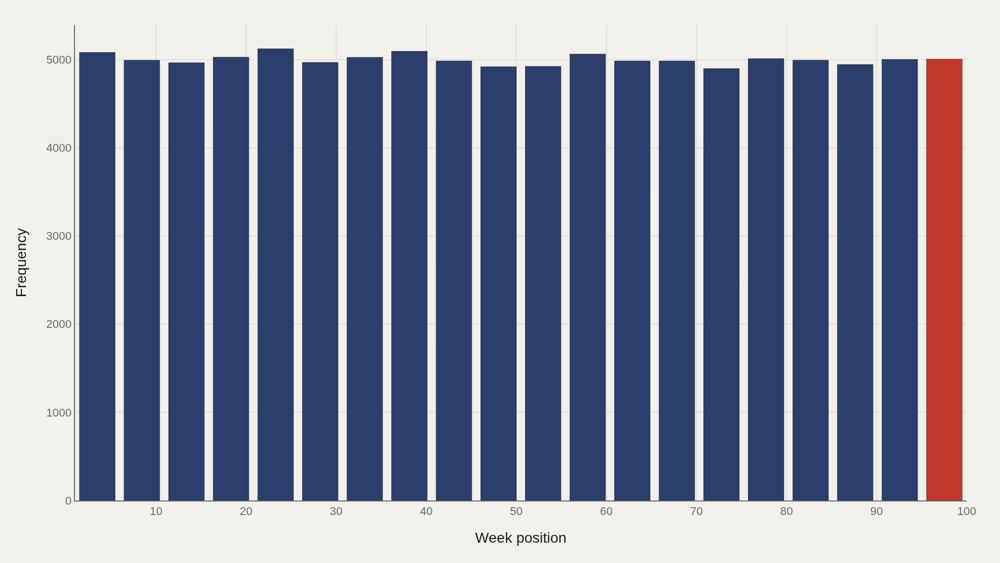
The distribution of week positions across the 100,000-row sample is remarkably even: bin counts hover near 5,000 observations across the 1–100 range. A full Hot 100 every week produces that rectangular shape by design. Uniform position counts are the baseline. Deviations in other charts — concentration among songs, re-entry instances — are where the cultural story lives.
Concentration Among Songs Is Mechanical at First
The Pareto curve over leading song entries rises in near-equal steps in this view, reaching 100% by the fifteenth plotted entry. Within the restricted leader set, share accumulates steadily rather than in a single spike. Full-catalog fame concentration is a different question; this curve describes the ranked subset on display, not every Hot 100 occupant since the 1950s.
Re-Entries Stretch a Song’s Life Without Guaranteeing Rank
Week position versus instance (re-entry or appearance count) shows titles returning to the chart at many ranks. High instance values appear across both strong and weak positions. Longevity on Billboard is not only about peaking at No. 1. It is also about how many times a song is allowed to reappear — a second career path the scatter makes visible.
What to take away
A 100,000-row Hot 100 extract is mostly a uniform grid of weekly ranks — median 50, full coverage from 1 to 100. The drama is in which songs repeatedly occupy that grid and which only touch position 100.
Cite the uniform distribution when explaining the chart’s structure; cite instance versus position when explaining how hits persist.
■ END
The Fine PrintBack of the BoxEnd Credits
NoteWarningsDisclaimer
Artometrics data brief. Figures come from the sources below. Derived shares and editorial indices are not audited financials.
SourcesContentsSources
- SourcePrevious version's source. Data Science Learning Community. (2021). TidyTuesday: Billboard Top 100. https://raw.githubusercontent.com/rfordatascience/tidytuesday/main/data/2021/2021-09-14/billboard.csv
- SourceBillboard Hot 100 chart data, via utdata/rwd-billboard-data (MIT), commit ff86f04, through the chart dated Oct 31, 2026. Coverage through October 31, 2026. Billboard is the original data owner.
- ReportFull report: artometrics.com/rankings
MethodAssemblyMethod
Numbers in this issue are the published figures. The skin changes type, rules, and chart color only.
PlatesMade byImage credits
- HeroArtometrics Billboard illustration.
- PlatePortrait of Luca Pacioli, attributed to Jacopo de' Barbari, c. 1495. Public domain, via Wikimedia Commons.
- PlateColor print of a toy shop, Utagawa Sadahide, 1860. The Metropolitan Museum of Art, CC0, via Wikimedia Commons.
- PlateBelasco Theatre box office, published November 1907 in Architects' and Builders' Magazine. Unknown photographer. Public domain, via Wikimedia Commons.


Updated through JUN 15, 2026.