



JUN 15, 2026 · Restaurants
Restaurants
NYC Inspection Scores Hit 156—Eleven Times the Median
NYC restaurant inspection scores cluster at 15; highest violation count reaches 156 in 100,000-record TidyTuesday extract.
By Kyle McAuliffe · · 4 min
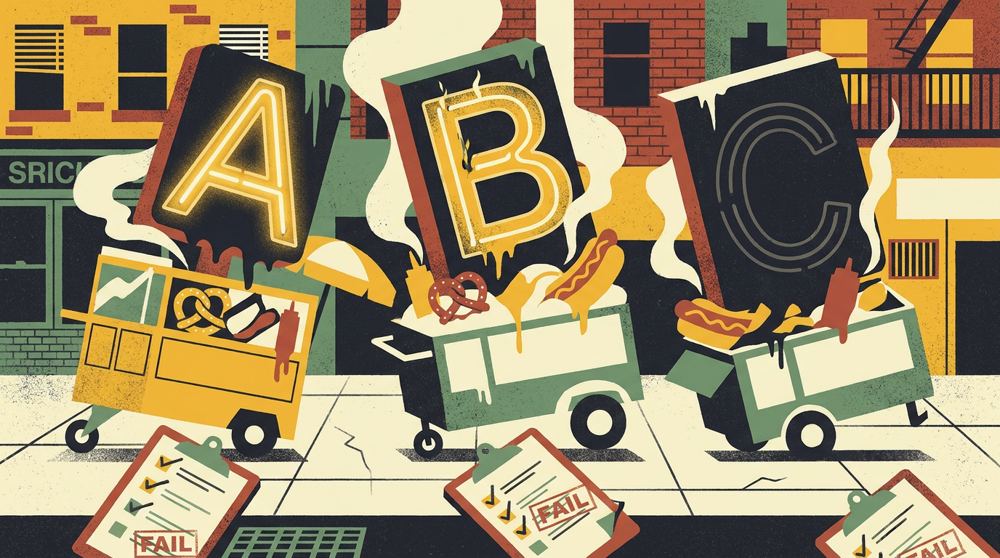
NYC restaurant inspection scores cluster at a median of 15.0 violation points, but the distribution stretches to 156 in a 100,000-record TidyTuesday extract — a span that letter grades compress into A, B, and C stickers.
The highest-scoring establishment in this extract, The Slope Lounge and Restaurant, logged 152 points. The top dozen violators post a median of 122. Grade A remains the most common public label, while the year span runs from placeholder 1900 through 2018, with inspection density concentrated in the 2010s.
Higher scores mean more violations, not better food — an inversion easy to forget once letter grades take over.
15.0
Median violation score across 100,000 inspections — most establishments stay well below penalty thresholds
156
Highest recorded score in extract — nearly eleven times the median, marking severe compliance failure
152
The Slope Lounge and Restaurant's score — leads top-violator list with median of 122 among worst dozen
How scores moved over time
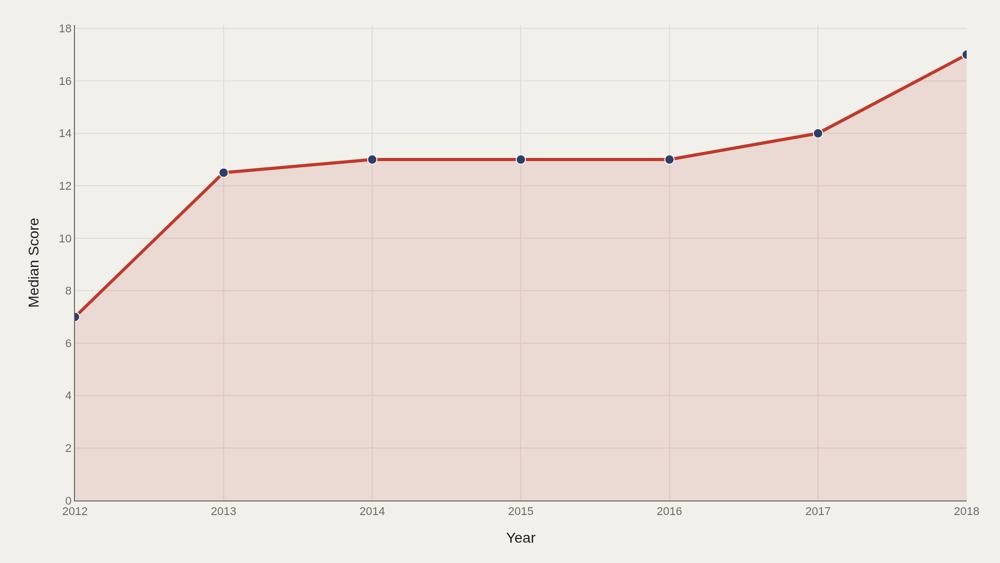
Median score over time tracks whether the typical inspected restaurant became cleaner, worse, or remained stable as the program matured. Flat stretches can signal stable compliance or consistent scoring practice. Early placeholder years carry little weight; most interpretive signal sits in the dense 2010–2018 window.
Who sits at the top of violation scores
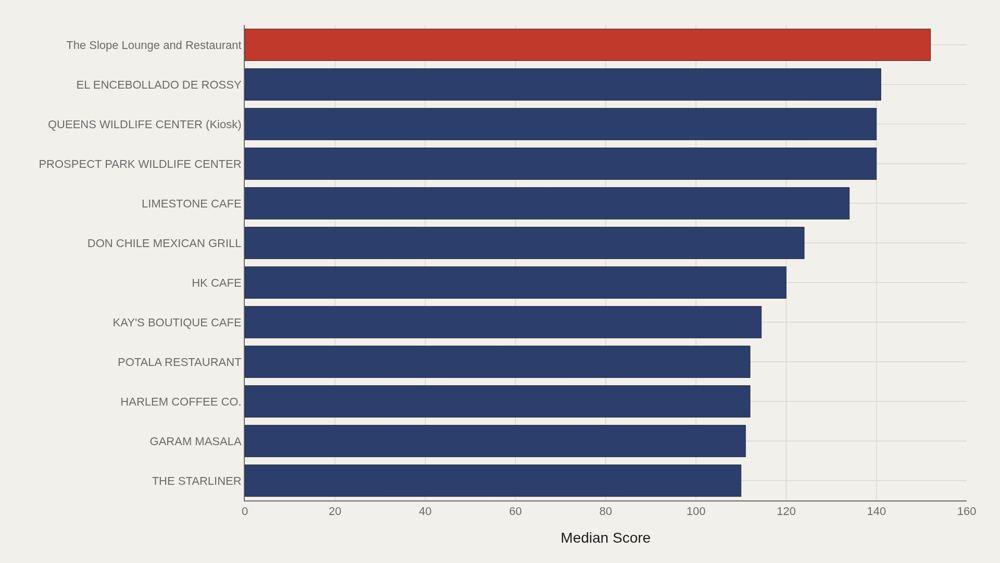
The Slope Lounge and Restaurant posts 152 points, with a median of 122 among the top dozen violators. These scores sit at the extreme end of a distribution where the overall median is 15. The head of the distribution is where enforcement drama concentrates. Single bad inspections can define a DBA's ranking even if later visits improve.
Scores by grade
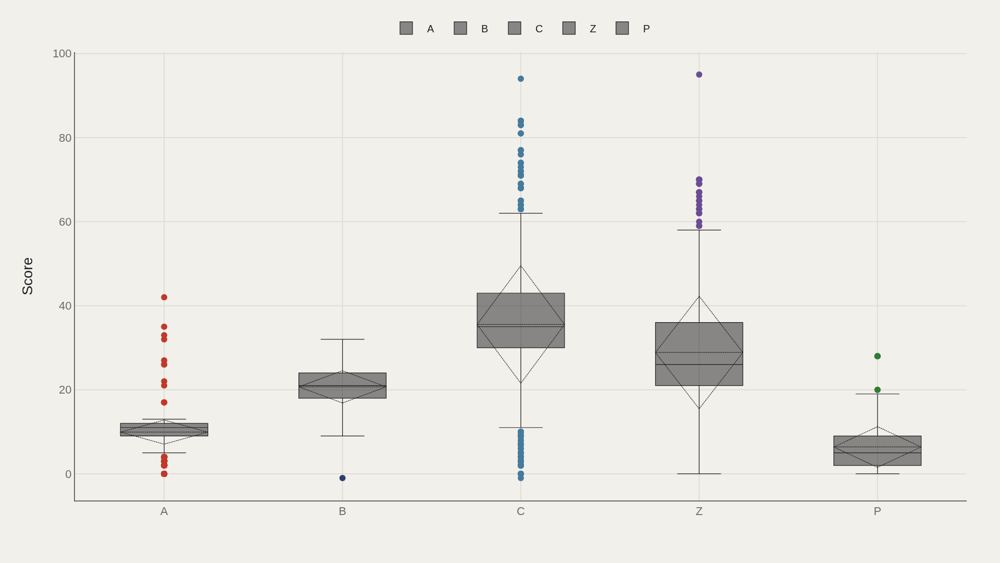
Box plots by grade show the numeric ranges that map onto A, B, C, and related labels. Grade A dominates the count; higher-letter grades occupy the upper score territory where violation points accumulate. The chart makes the letter system's compression visible: many different numeric outcomes share an A, while public debate concentrates on rarer worse grades.
Who beats the median — and who trails
The gap chart ranks grades above or below the median score. Worse letter grades sit far above the median by design; A sits at or below it. The geometry is the grading rule made visual. What remains notable is the within-grade spread on the previous chart: even A is a band, not a point, and policy arguments often happen inside that band.
Scores and identifiers
Plotting score against CAMIS identifiers is mostly a diagnostic scatter: restaurant IDs are not a substantive X-axis, but the cloud shows how scores disperse across the universe of establishments rather than clustering on a few names. When substantive covariates are thin, an ID scatter refuses to invent a prettier relationship than the table supports.
What to take away
NYC restaurant inspections cluster at a median of 15 violation points, with a long tail extending past 150. Grade A dominates the public display; extreme scores are rare but visible in the data.
The inversion remains: higher numbers are worse, letter grades compress a wide numeric band, and the window sticker is only the headline of a point system running underneath.
■ END
The Fine PrintBack of the BoxEnd Credits
NoteWarningsDisclaimer
Artometrics data brief. Figures come from the sources below. Derived shares and editorial indices are not audited financials.
SourcesContentsSources
- SourceThe source is the TidyTuesday release built from NYC restaurant inspection open data via the R for Data Science community. The working file contains 100,000 rows sampled from the full dataset, with fields including DBA names, boroughs, s…
- ReportFull report: artometrics.com/restaurants
MethodAssemblyMethod
Numbers in this issue are the published figures. The skin changes type, rules, and chart color only.
PlatesMade byImage credits
- HeroArtometrics Restaurants illustration.
- PlatePortrait of Luca Pacioli, attributed to Jacopo de' Barbari, c. 1495. Public domain, via Wikimedia Commons.
- PlateColor print of a toy shop, Utagawa Sadahide, 1860. The Metropolitan Museum of Art, CC0, via Wikimedia Commons.
- PlateBelasco Theatre box office, published November 1907 in Architects' and Builders' Magazine. Unknown photographer. Public domain, via Wikimedia Commons.


Updated through JUN 15, 2026.