



JUL 1, 2026 · States
States
California vs. Texas on Seven Economic Dimensions
California scores 96 on GDP, 94 on tech; Texas scores 96 on energy, 91 on migration attention. Seven dimensions explain why the comparison persists.
By Kyle McAuliffe · · 4 min

California scores 96 on GDP scale, 94 on tech role, and 91 on cultural output. Texas scores 96 on energy, 91 on migration attention, and 86 on GDP. The rivalry persists because each state represents a distinct governance model, export system, and labor market—not because they are interchangeable.
The charts score 2 state systems across 7 rivalry dimensions and 7 export families. They are designed to stop the comparison from collapsing into a single tax talking point and to surface the six questions worth asking next.
96
California's GDP scale score vs. 86 for Texas—both large enough to function as competing national models
94
California's tech role score; Texas scores 96 on energy—divergent export systems, not substitutable strengths
91
Texas migration attention score vs. California's 88 tax-burden debate score—cost, climate, wages, and culture drive relocation, not taxes alone
Why They Are Compared
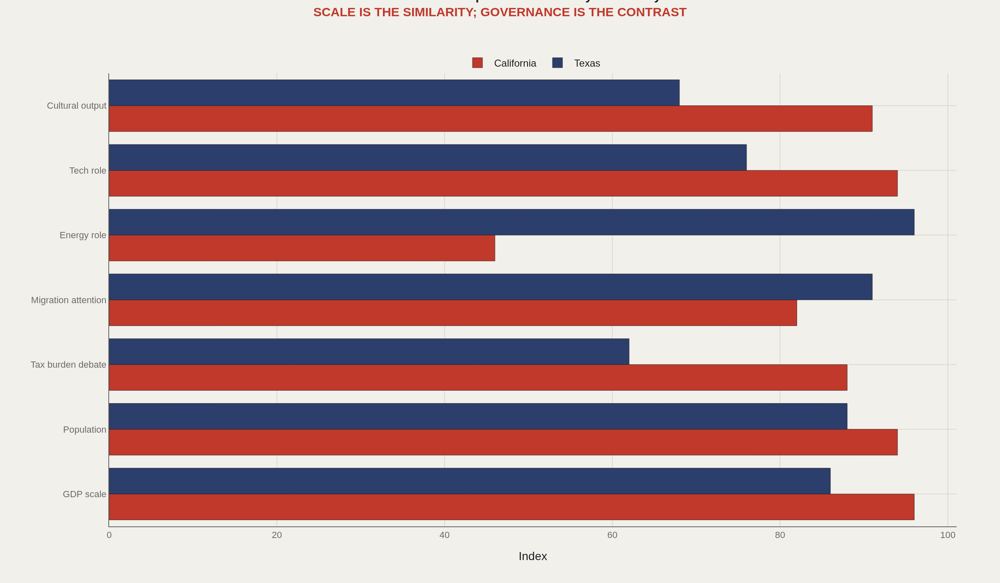
California scores 96 on GDP scale, 94 on population, 94 on tech role, and 91 on cultural output, with a tax-burden debate score of 88 and an energy-role score of 46. Texas scores 96 on energy, 91 on migration attention, 88 on population, and 86 on GDP scale, while cultural output sits at 68. They are competing governance models, labor markets, export systems, and migration symbols—not interchangeable states with different logos.
Growth Model
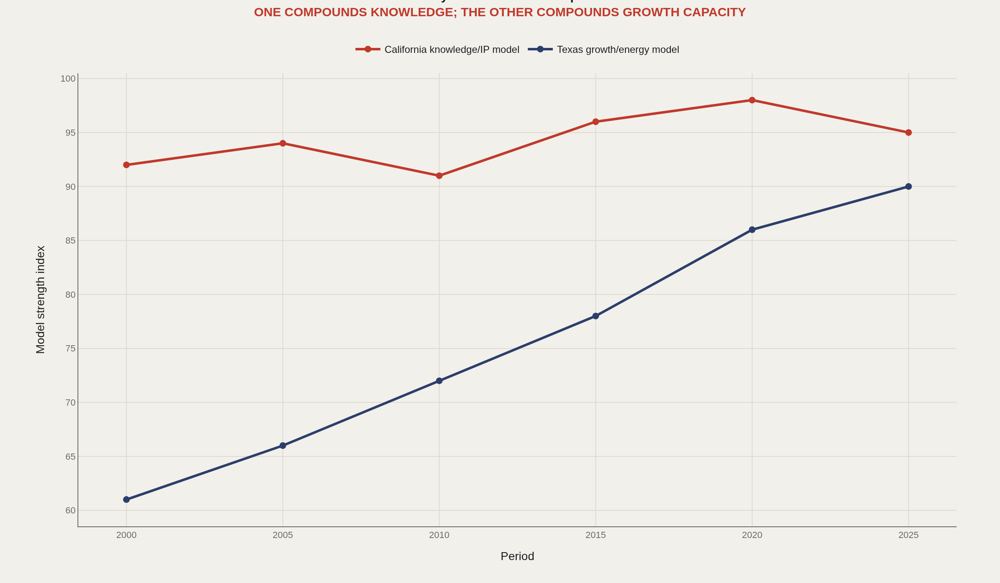
California's knowledge/IP model index remains high across the timeline—from the low 90s in 2000–2010 to a peak near 98 in 2020. Texas's growth/energy model climbs from 61 in 2000 to 90 by 2025. One compounds intellectual property, entertainment, venture networks, and universities. The other compounds energy, land, logistics, and relocation capacity. The rivalry persists because the models are not substitutes.
Export Fingerprint
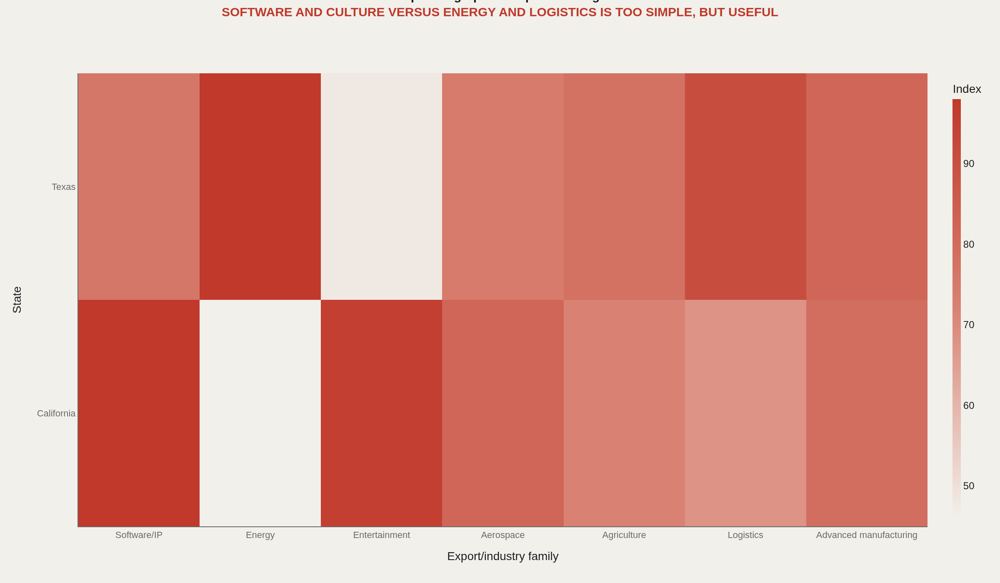
The export fingerprint contrasts software/IP, entertainment, and related strengths on the California side with energy and logistics weight on the Texas side. Agriculture, aerospace, and other families overlap in more complicated ways than slogan versions admit. Same-scale GDP conversations hide different machinery. What each state sells to the world is the cleanest way to keep the comparison honest.
Hidden Tradeoffs
Cost, climate risk, wages, culture, and business formation do not move as a single tax variable. The tradeoff scatter keeps multiple dimensions in view at once—high-cost magnetism on one side, capacity and exposure on the other. California's wage ceiling and cultural pull are real; Texas's formation and logistics advantages are real; energy and climate risk are real. A serious comparison refuses to delete any of those axes.
What to Ask Next
The ranked questions elevate talent compounding (95), irreplaceable exports (93), climate handling (91), who benefits from growth (88), whether migration is tax-driven (86), and what each state must import (79). The useful prompt is not "which state is better?" It is which capabilities each system cannot copy from the other—the starting point for migration, housing, export, and culture follow-ups.
What to take away
California and Texas remain comparable because they are two large answers to how America organizes scale, talent, land, energy, and culture.
Taxes are the entry point; export identity, climate risk, talent compounding, and cultural magnetism are where the comparison becomes specific enough to measure.
■ END
The Fine PrintBack of the BoxEnd Credits
NoteWarningsDisclaimer
Artometrics data brief. Figures come from the sources below. Derived shares and editorial indices are not audited financials.
SourcesContentsSources
- SourceBEA. State GDP by industry.
- SourceU.S. Census ACS and population estimates.
- SourceIRS migration data summaries.
- SourceBLS state employment statistics.
- SourceInternational Trade Administration and OEC export references.
- SourceState budget and tax agency documents.
- ReportFull report: artometrics.com/rivalry
MethodAssemblyMethod
Numbers in this issue are the published figures. The skin changes type, rules, and chart color only.
PlatesMade byImage credits
- HeroArtometrics States illustration.
- PlatePortrait of Luca Pacioli, attributed to Jacopo de' Barbari, c. 1495. Public domain, via Wikimedia Commons.
- PlateColor print of a toy shop, Utagawa Sadahide, 1860. The Metropolitan Museum of Art, CC0, via Wikimedia Commons.
- PlateBelasco Theatre box office, published November 1907 in Architects' and Builders' Magazine. Unknown photographer. Public domain, via Wikimedia Commons.


Updated through JUL 1, 2026.