



JUN 15, 2026 · Schools
Schools
School Diversity Peaks at 85.3 While the Median Holds at 2.38
Butteville Union Elementary scores 85.3 on the Multi index while the national median sits at 2.38 across 27,944 local education agencies.
By Kyle McAuliffe · · 5 min

Butteville Union Elementary scores 85.3 on the Multi diversity index while the national median sits at 2.38 across 27,944 local education agencies. The 35-fold gap between the top district and the median defines the shape of U.S. school diversity: a flat center and an extreme upper tail.
27,944
Local education agencies in the working file — establishes coverage
2.38
Median Multi across all schools — defines the flat center of the distribution
85.3
Butteville Union Elementary's Multi score — marks the upper extreme
A flat median hides how extreme the upper tail is
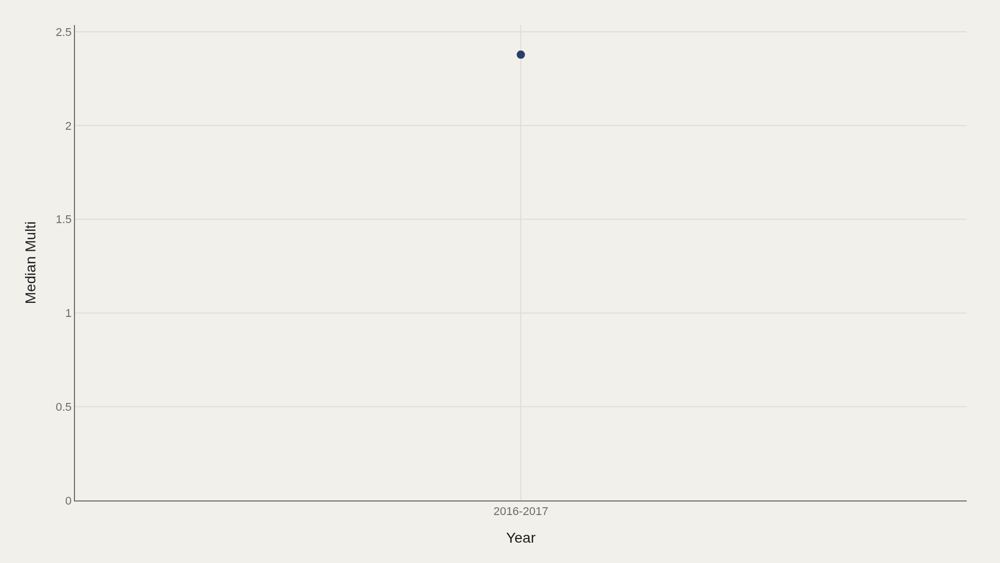
The median Multi sits at 2.38 in the opening period and 2.38 at the close — a flat line at the center of the distribution. Stability at the median does not mean stability everywhere; it means the typical school's Multi did not move in this snapshot window. That flat center is the baseline against which the leaderboard should be read. The action in school diversity here is not a national median march — it is how far individual LEAs sit above that center. U.S. school diversity is often narrated through landmark legal periods: Brown v. Board of Education in 1954, the busing and desegregation orders of the 1960s and 1970s, the release from court supervision in later decades, and contemporary residential segregation. Those histories are real, but this chart is not a long legal history; it is a snapshot-style metric view where the center does not move. A stable center can coexist with sharp local change because public education is geographically partitioned. District boundaries, housing markets, charter growth, school assignment rules, and private-school exit can all alter individual LEAs without moving the national median much. The chart tells readers to look for distributional extremes rather than assume a single national trend.
Butteville Union Elementary leads a steep LEA ladder
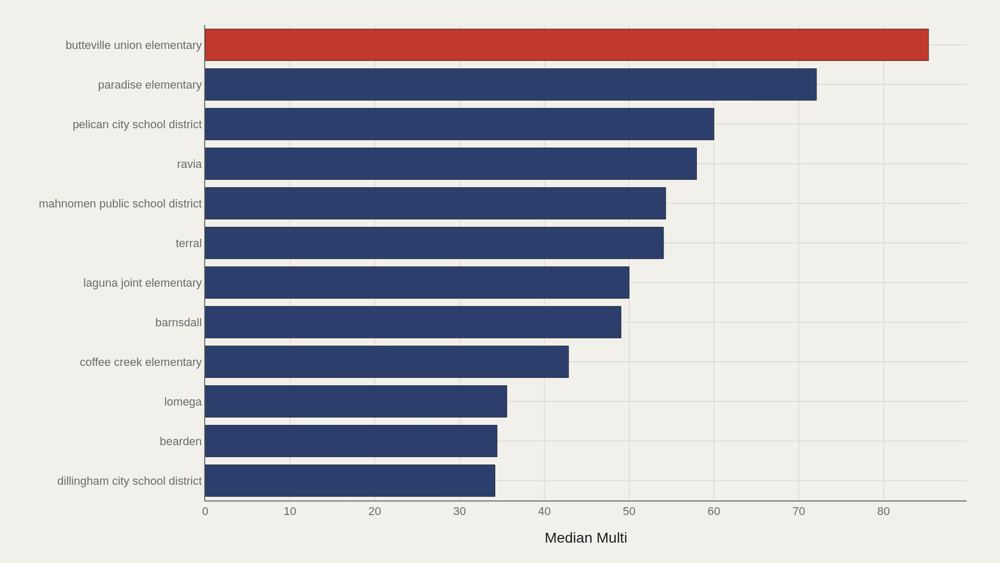
Butteville Union Elementary leads at 85.3 Multi. Among the top dozen LEAs, the median is 52.0 — still many times the file-wide median of 2.38. The leaderboard is an upper-tail map of districts whose composition scores sit far from the typical school. LEA names on this chart carry the highest observed Multi values in the file. They are not a random sample of American schooling; they are the extreme cases the metric surfaces first. Butteville Union Elementary is a named local education agency rather than a state system, which is exactly why the scale warning matters. A small district can produce an extreme composition metric if its enrollment mix is unusual, if denominators are small, or if categories split more evenly than in larger systems. The top of the ladder is a place to investigate, not a national template. The top-dozen median of 52.0 confirms that the upper tail is not one data-entry spike. Several LEAs sit in a high-Multi band that is many times the file-wide center. In education data, that kind of gap often reflects the interaction of neighborhood demography, district boundaries, grade configuration, and reporting categories.
State boxes show how Multi spreads geographically
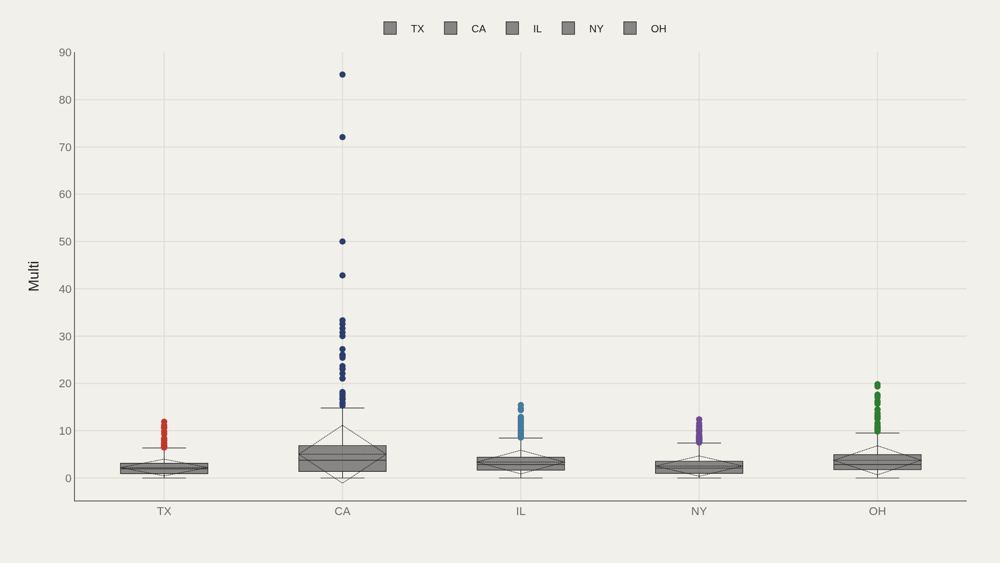
Splitting Multi by state (ST) produces category boxes that reveal whether diversity scores are shared or contested across jurisdictions. Texas appears most often in the file, but frequency of rows is not the same as high Multi; volume and score must be read separately. The state axis is useful because education policy and demography both vary geographically. The boxes show the within-state spread that a single national median erases. Texas appearing most often is not surprising in a school file: it is a large state with many districts, fast-growing metropolitan regions, and substantial racial and ethnic diversity across Houston, Dallas-Fort Worth, San Antonio, Austin, the Rio Grande Valley, and rural counties. But row frequency mainly measures how much Texas appears in the extract, not whether every Texas LEA scores high on Multi. State boxes are also institutional boxes. School finance rules, district consolidation, county governance, accountability systems, and enrollment reporting vary by state education agencies. A state-level spread therefore mixes demography with administrative design, which is why the box plot is more informative than a single state average.
What to take away
The national median Multi of 2.38 is stable in the available trend window, while individual LEAs such as Butteville Union Elementary reach 85.3. Diversity here is a long-tailed property: the center barely moves, and the extremes define the drama.
■ END
The Fine PrintBack of the BoxEnd Credits
NoteWarningsDisclaimer
Artometrics data brief. Figures come from the sources below. Derived shares and editorial indices are not audited financials.
SourcesContentsSources
- SourceData Science Learning Community. (2019). TidyTuesday: School Diversity. https://raw.githubusercontent.com/rfordatascience/tidytuesday/main/data/2019/2019-09-24/school_diversity.csv
- SourceData Science Learning Community. (2019). TidyTuesday School Diversity source folder. https://github.com/rfordatascience/tidytuesday/tree/main/data/2019/2019-09-24
- SourceNational Center for Education Statistics. Common Core of Data. https://nces.ed.gov/ccd/
- SourceReardon, S. F., & Owens, A. (2014). 60 years after Brown: Trends and consequences of school segregation. Annual Review of Sociology, 40, 199–218. https://doi.org/10.1146/annurev-soc-071913-043152
- ReportFull report: artometrics.com/schools
MethodAssemblyMethod
Numbers in this issue are the published figures. The skin changes type, rules, and chart color only.
PlatesMade byImage credits
- HeroArtometrics Schools illustration.
- PlatePortrait of Luca Pacioli, attributed to Jacopo de' Barbari, c. 1495. Public domain, via Wikimedia Commons.
- PlateColor print of a toy shop, Utagawa Sadahide, 1860. The Metropolitan Museum of Art, CC0, via Wikimedia Commons.
- PlateBelasco Theatre box office, published November 1907 in Architects' and Builders' Magazine. Unknown photographer. Public domain, via Wikimedia Commons.


Updated through JUN 15, 2026.