



JUL 1, 2026 · San Francisco
San Francisco
Can It Absorb Its Own Invention Machine?
A small city exports global software wealth while underbuilding the physical infrastructure to metabolize it.
By Kyle McAuliffe · · 4 min

San Francisco generated $204 billion in regional GDP in 2023 while restricting housing construction to a 47-square-mile peninsula—a spatial mismatch that defines the city's core economic contradiction.
The city is measurably unusual: 870,000 residents produce software, venture capital, and cultural permission at a scale associated with metros ten times larger. The question is whether a place can sustain an invention machine that outpaces its physical infrastructure.
This framework defines the identity signals and open questions any data-driven San Francisco portrait must address. It does not resolve them.
1,100+ datasets
DataSF public portal provides building permits, business registrations, 311 cases, and transit data at block level
7 identity domains
Software, finance coordination, cultural production, housing scarcity, transit dependency, downtown vacancy, and demographic turnover define city metabolism
3 core tradeoffs
Technology concentration rose faster than housing supply, cultural retention, and physical infrastructure could adapt
Identity Stack
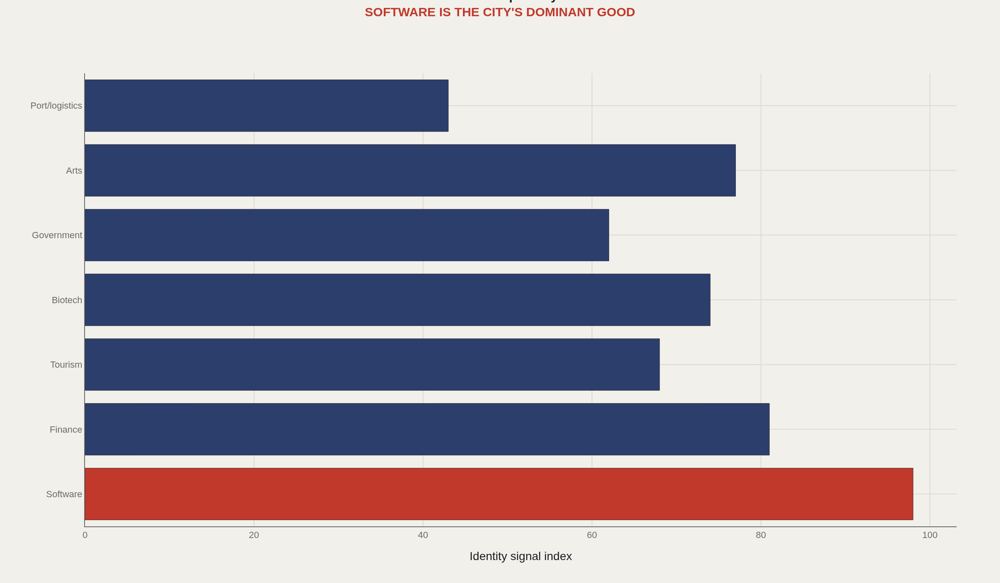
The city's export profile is not apps—it is systems. San Francisco produces venture capital allocation logic, engineering talent pipelines, platform business models, and institutional permission for high-risk ideas. This explains why a city with 870,000 residents can anchor a $204 billion regional economy. The identity stack shows relative strength across seven dimensions: software engineering concentration, finance coordination infrastructure, cultural production capacity, housing scarcity, transit dependency, downtown vacancy, and demographic turnover. Each variable is scored against comparable metros.
Tradeoff History
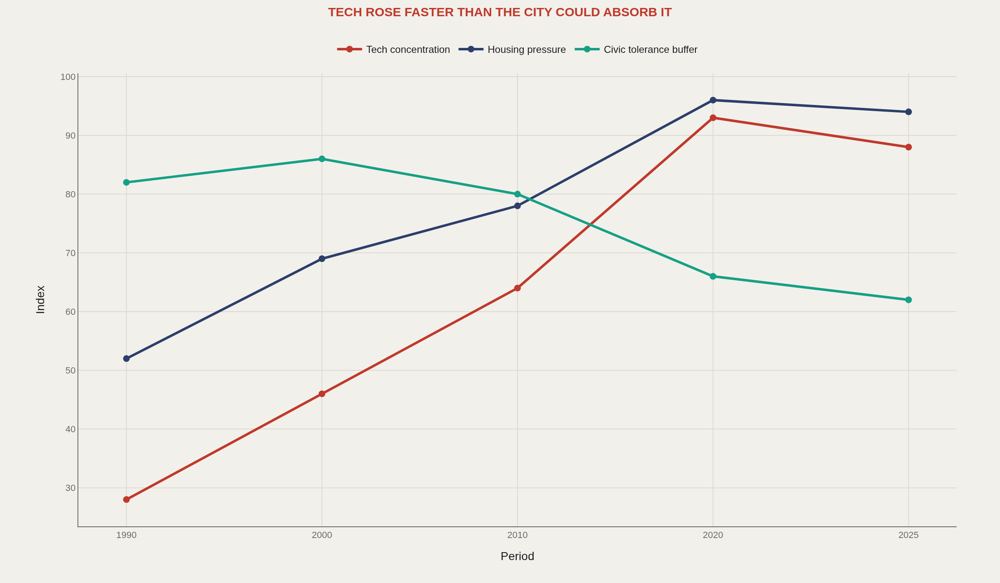
San Francisco's economic success is inseparable from its absorption failure. A constrained peninsula geography concentrated global software wealth while housing production remained flat, transit capacity stagnated, and cultural infrastructure lost ground to commercial displacement. The hypothesis to test: housing scarcity, downtown vacancy, transit underinvestment, and cultural venue loss are symptoms of the same structural mismatch between economic output and physical capacity.
Neighborhood Pressure
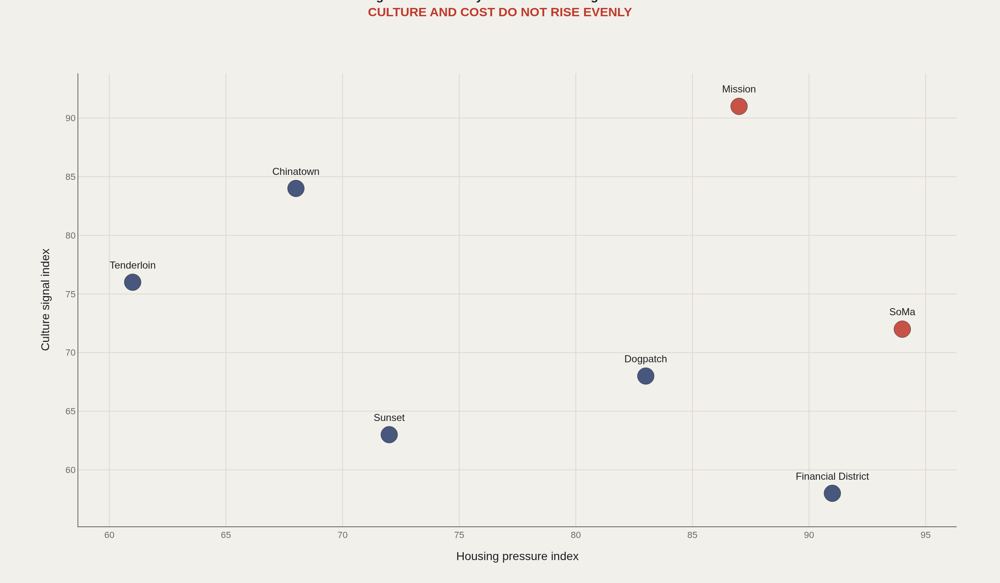
Citywide averages obscure the mechanism. SoMa carries tech office concentration and homelessness. The Mission balances Latino cultural continuity against rapid gentrification. Chinatown maintains immigrant commercial networks under extreme density. The Tenderloin functions as the city's social safety valve. The Sunset retains middle-class stability through distance from downtown. DataSF's block-level granularity matters because San Francisco's 47 square miles make neighborhood-scale data analytically meaningful. The next report will map building permits, business licenses, 311 service requests, and transit usage against rent, displacement, and cultural venue persistence.
Competitor Set
Seattle competes on software engineering density. New York competes on capital networks and operational scale. Boston competes on research institution depth. Austin competes on cost and relocation appeal. Los Angeles competes on creative labor and entertainment infrastructure. London competes on finance coordination and time-zone positioning. The relevant competitor depends on the contested variable: venture capital flow, engineering talent, housing cost, cultural production, or research commercialization. No single city dominates across all dimensions.
Open Questions
The next report should not rank San Francisco against a generic benchmark. It should test whether the city can build sufficient housing to retain middle-income workers, refill downtown office space after remote work normalization, preserve cultural production under commercial displacement pressure, keep AI research and deployment within the regional ecosystem, integrate biotech growth into the same venture and talent infrastructure, and coordinate transit across city-county boundaries. These are bioeconomic questions: can a place metabolize the output of its strongest competitive advantage without exhausting the social and physical substrate that enables it?
What to take away
San Francisco's core identity is an invention machine constrained by absorption capacity. The city generates software systems, venture capital, and cultural permission faster than it builds housing, office infrastructure, or transit to support them.
This claim can be tested against DataSF building permits, business registration trends, office vacancy rates, transit ridership recovery, migration flows, venture capital deployment, payroll tax data, and cultural venue licensing. The framework is defined. The measurement follows.
■ END
The Fine PrintBack of the BoxEnd Credits
NoteWarningsDisclaimer
Artometrics data brief. Figures come from the sources below. Derived shares and editorial indices are not audited financials.
SourcesContentsSources
- SourceDataSF / SF.gov. Open Data portal and developer documentation.
- SourceSocrata / SODA API documentation.
- SourceBEA. Metropolitan GDP and regional data.
- SourceU.S. Census ACS. Housing, income, commuting, and demographic tables.
- SourceInternational Trade Administration. Metropolitan Export Series.
- SourceWorld Cities Culture Forum. CREATIVE Data Framework.
- ReportFull report: artometrics.com/sf
MethodAssemblyMethod
Numbers in this issue are the published figures. The skin changes type, rules, and chart color only.
PlatesMade byImage credits
- HeroArtometrics San Francisco illustration.
- PlatePortrait of Luca Pacioli, attributed to Jacopo de' Barbari, c. 1495. Public domain, via Wikimedia Commons.
- PlateColor print of a toy shop, Utagawa Sadahide, 1860. The Metropolitan Museum of Art, CC0, via Wikimedia Commons.
- PlateBelasco Theatre box office, published November 1907 in Architects' and Builders' Magazine. Unknown photographer. Public domain, via Wikimedia Commons.


Updated through JUL 1, 2026.