



JUN 15, 2026 · Simpsons
Simpsons
Marcia Wallace, 175 Guest Appearances
Marcia Wallace logged 175 guest appearances across 30 Simpsons seasons—2.7× more than the second-place performer in the TidyTuesday dataset.
By Kyle McAuliffe · · 2 min
Marcia Wallace logged 175 guest appearances across 30 Simpsons seasons—2.7× more than the second-place performer and the highest count in the TidyTuesday dataset released August 27, 2019.
The snapshot captures 1,381 guest records spanning Seasons 1–30. Season 24 recorded the highest guest density with 65 appearances, while most guests appeared only once.
175
Marcia Wallace's appearance count across 30 seasons — 2.7× the second-place guest
65
Guest appearances in Season 24 — the peak density across all seasons
1,381
Total guest records in the 2019 TidyTuesday snapshot covering Seasons 1–30
Volume
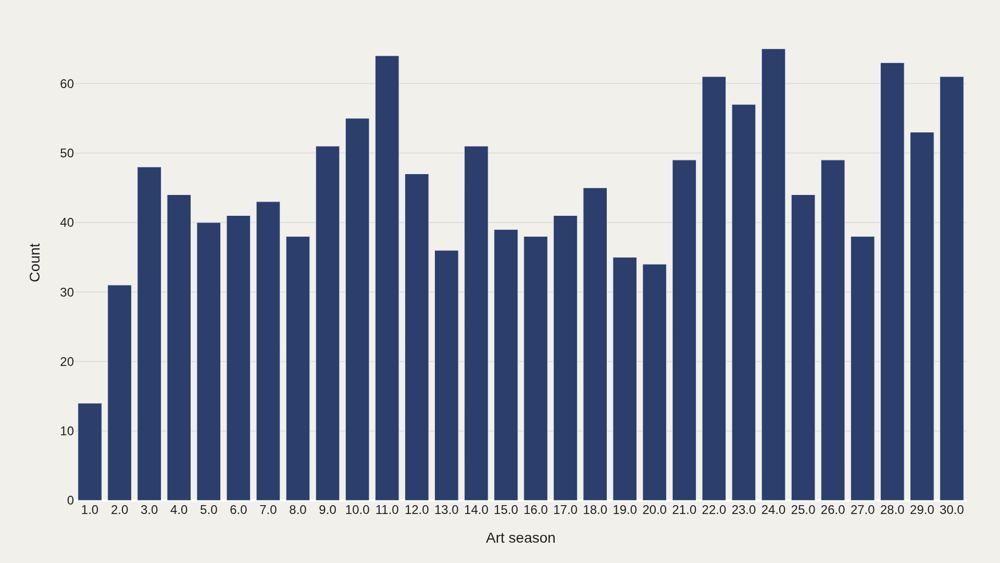
Activity peaks in Season 24 with 65 records. Period-level counts reveal when guest-appearance frequency intensified.
Who sits at the top
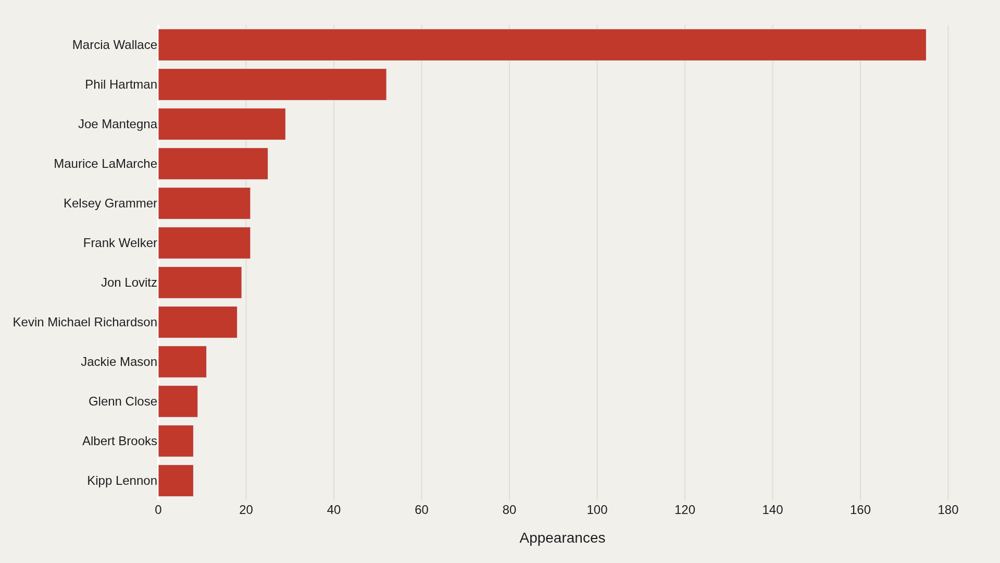
Marcia Wallace appears 175 times—the most recurring name in the file. The top dozen account for a visible share of all 1,381 rows.
Timeline
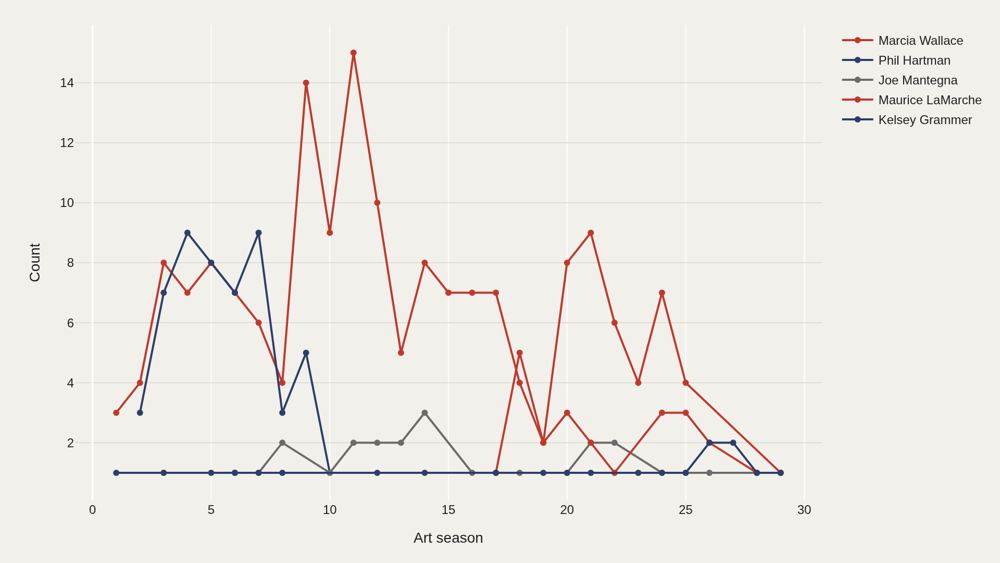
The leading names do not move in lockstep—some fade as others surge. Tracking counts over time separates sustained presence from one-season spikes.
Frequency
Most guest stars appear only once; a small cluster revisits repeatedly. This power-law shape is typical of guest lists, credits, and catalog-style tables.
Mix
Season 24 is the most repeated season in the extract. Secondary dimensions add context when the primary table has no numeric score column.
What to take away
Read as a teaching map, this dataset shows why one metric is rarely enough: leaders, tails, trends, and relationships each answer a different question about guest-appearance patterns.
The best reading is modest: use the chart to sharpen the question, then check the source and limits before turning it into a claim.
■ END
The Fine PrintBack of the BoxEnd Credits
NoteWarningsDisclaimer
Artometrics data brief. Figures come from the sources below. Derived shares and editorial indices are not audited financials.
SourcesContentsSources
MethodAssemblyMethod
Numbers in this issue are the published figures. The skin changes type, rules, and chart color only.
PlatesMade byImage credits
- HeroArtometrics Simpsons illustration.
- PlatePortrait of Luca Pacioli, attributed to Jacopo de' Barbari, c. 1495. Public domain, via Wikimedia Commons.
- PlateColor print of a toy shop, Utagawa Sadahide, 1860. The Metropolitan Museum of Art, CC0, via Wikimedia Commons.
- PlateBelasco Theatre box office, published November 1907 in Architects' and Builders' Magazine. Unknown photographer. Public domain, via Wikimedia Commons.


Updated through JUN 15, 2026.