



JUN 15, 2026 · Games
Games
A Dozen Steam Titles Captured Half the Audience
Median concurrent players climbed from 212 to 309 across the decade, but Dota 2's 475,924 average dwarfs the top-twelve median of 64,656.
By Kyle McAuliffe · · 4 min
Median average concurrent players on Steam rose from 212 to 309 between 2012 and 2021, a 46 % climb that still leaves the typical title-month at 203 in an 83,631-row extract. Dota 2 leads at 475,924 Avg — 7.4 times the top-twelve median — and the file's single highest observation reaches 1,584,887. January runs 36.9 above the median; October trails by 23.3.
The file is the TidyTuesday 2021-03-16 video-games release, merged from community-cleaned Steam player-count snapshots. Charts trace the median's climb, rank the leaders by Avg, map month offsets, and plot Avg against Gain to show how level and change co-occur in a long-tailed market.
203
Median Avg across all 83,631 title-months, the center of a long-tailed concurrency distribution
46 %
Growth from opening median of 212 to closing median of 309 between 2012 and 2021
475,924
Dota 2 leads the top-twelve by a factor of 7.4 over the group's median of 64,656
Median concurrency climbed across the decade
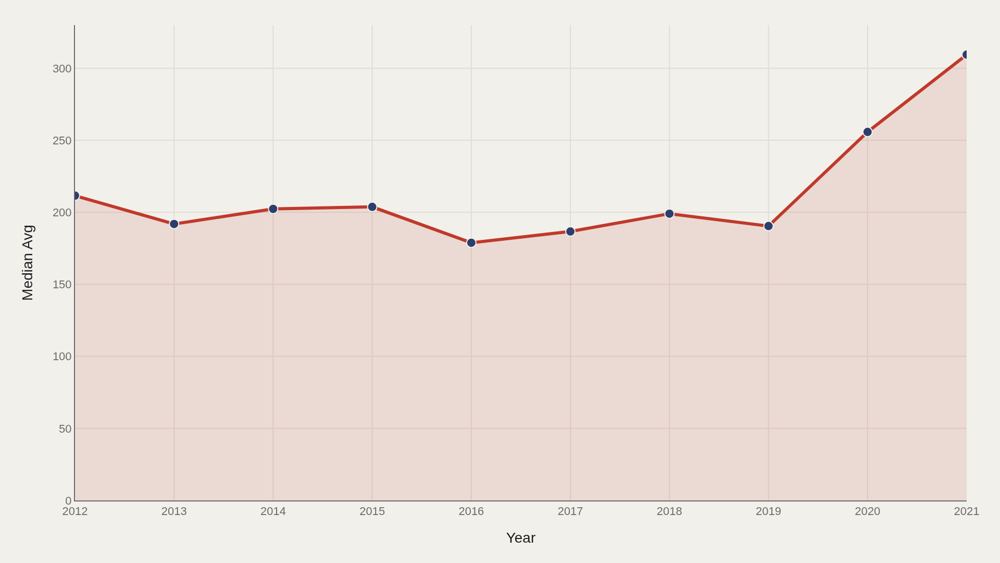
Median Avg rises from 212 at the series open to 309 at the close, crossing above the file median of 203 midway through the period. The 46 % gain reflects either platform growth, survivor bias among tracked titles, or both. The chart reports the center's path. Individual titles distribute around that median in ways the trend line does not capture.
Dota 2 leads a top tier that drops off fast
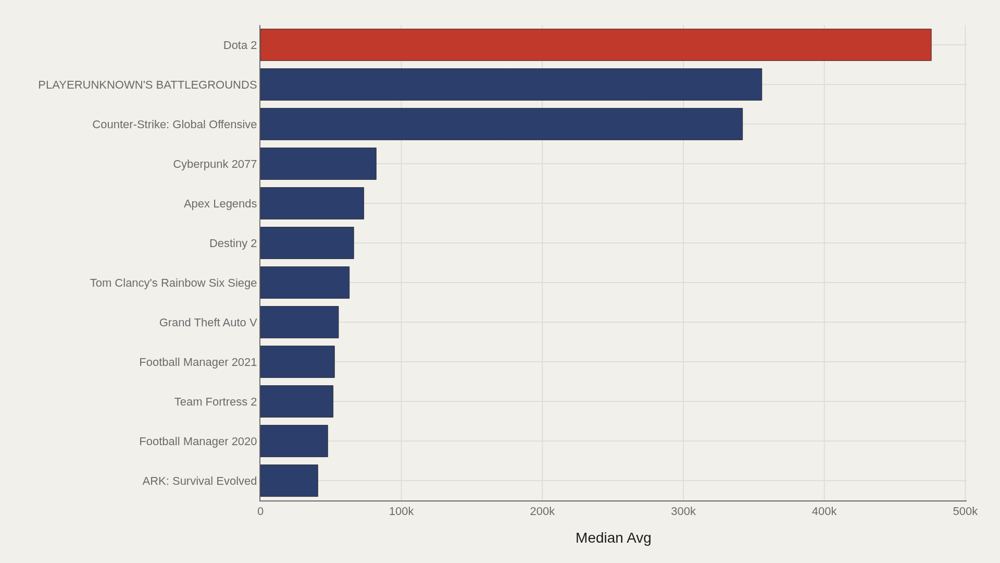
Dota 2 leads at 475,924 Avg, 7.4 times the top-twelve median of 64,656. The gap from first to the elite-tier median defines the live-service economy: a few titles sustain city-scale populations; the rest of the top dozen are large but operate in a different order of magnitude. The file's highest single Avg — 1,584,887, appearing in the PLAYERUNKNOWN'S BATTLEGROUNDS record set — sits above even the charted leaders, marking the extreme ceiling of the distribution.
Months carry different concurrency distributions
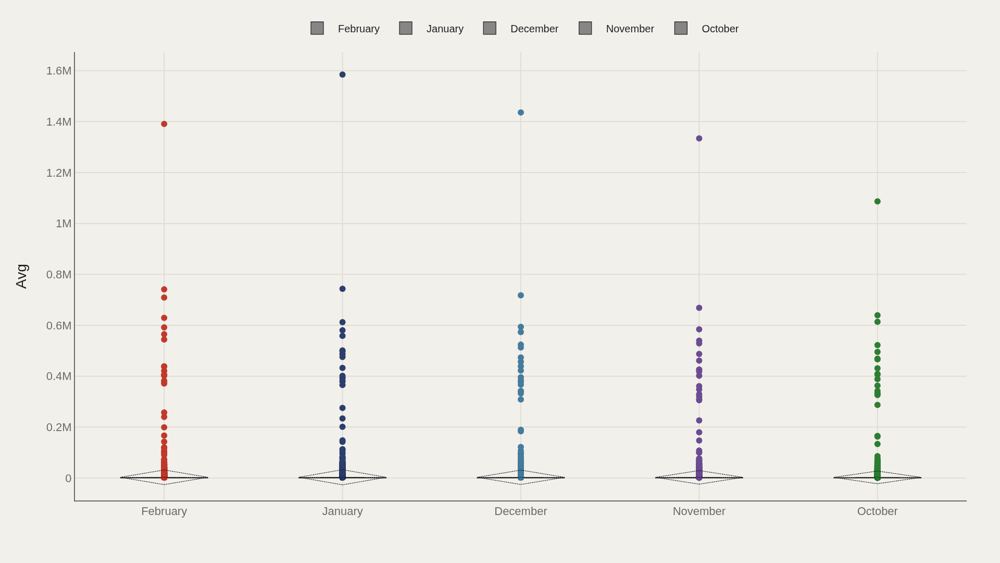
Box plots by month reveal whether Avg spreads uniformly or clusters around distinct medians across the calendar. Seasonal launches, holidays, and school schedules can shift who is online. February's frequency in the file is a coverage fact, not a player-count claim; the boxes measure dispersion within each month, not record volume.
January clears the median; October trails
January sits 36.9 above the file median; October trails by 23.3. Those signed offsets convert the calendar into a comparable scale against the center, revealing structural month effects in this extract. The offsets are not proof of a universal gaming season — coverage dates, launch windows, and sample composition all shape the pattern — but they are concrete enough to cite when asking when concurrency runs hot or cold in this snapshot.
Avg and Gain form a joint cloud of winners and churn
Plotting Avg against Gain reveals clusters that medians erase: high average with stable gain is a different audience story from high average with volatile gain, and low average with positive gain signals a trajectory invisible in rank tables. The scatter maps how level and change co-occur across the 83,631 title-months, showing the joint distribution that single-metric summaries cannot capture.
What to take away
The file median of 203 Avg anchors an 83,631-row distribution that rose from 212 to 309 at the median between 2012 and 2021, a 46 % climb. Dota 2 leads at 475,924, 7.4 times the top-twelve median, and the single highest observation reaches 1,584,887.
January sits 36.9 above the median; October trails by 23.3. Avg–Gain scatter plots show how level and momentum travel together in a long-tailed live-service market where a few titles capture city-scale audiences and the typical game serves hundreds.
■ END
The Fine PrintBack of the BoxEnd Credits
NoteWarningsDisclaimer
Artometrics data brief. Figures come from the sources below. Derived shares and editorial indices are not audited financials.
SourcesContentsSources
MethodAssemblyMethod
Numbers in this issue are the published figures. The skin changes type, rules, and chart color only.
PlatesMade byImage credits
- HeroArtometrics Games illustration.
- PlatePortrait of Luca Pacioli, attributed to Jacopo de' Barbari, c. 1495. Public domain, via Wikimedia Commons.
- PlateColor print of a toy shop, Utagawa Sadahide, 1860. The Metropolitan Museum of Art, CC0, via Wikimedia Commons.
- PlateBelasco Theatre box office, published November 1907 in Architects' and Builders' Magazine. Unknown photographer. Public domain, via Wikimedia Commons.


Updated through JUN 15, 2026.