



JUN 15, 2026 · Super Bowl
Super Bowl
Five Brands Capture 87% of Ad Views
NFL leads at 403,641 views; median dropped from 111,814 to 33,766 as the 2006–2021 archive filled with ordinary uploads.
By Kyle McAuliffe · · 4 min
Five brands capture 87% of all post-game Super Bowl ad views on YouTube, according to 247 uploads spanning 2006–2021. Median views fell from 111,814 to 33,766 as the archive expanded, but the ceiling reached 176,373,378—proof that a handful of commercials become folklore while most settle into inventory. NFL leads the top-twelve brand median at 403,641 views; Doritos ranks first in the full-file aggregation.
Post-game streaming attention operates as its own economy. Broadcast buys the first audience; YouTube decides which spots circulate for years. The dataset tracks that second life through trend, brand leaders, format distribution, concentration, and the relationship between views and likes.
87%
Five brands control this share of aggregate views
41,379
Median views across 247 uploads, down from 111,814 in the earliest period
176,373,378
Peak view count, 4,200× the median
Median views fell as the archive got denser
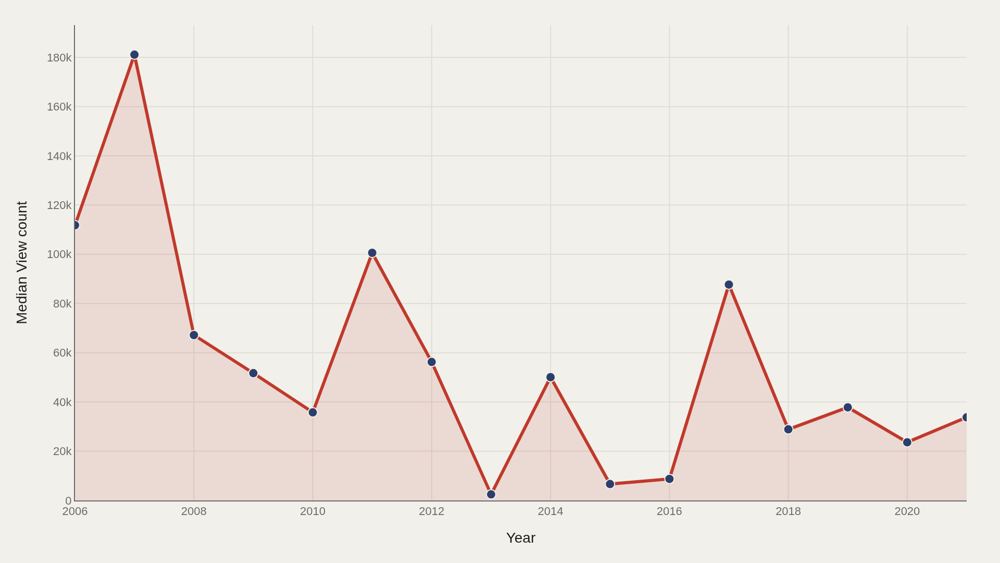
Median view count fell from 111,814 in the earliest period to 33,766 at the end of the span. That decline does not signal deteriorating ad quality—it reflects the archive filling out with more ordinary uploads, pulling the center down while the ceiling remained stratospheric at 176,373,378. The falling median and the fixed ceiling coexist because attention is power-law distributed: most ads cluster near the median, a few explode into viral territory.
NFL leads the brand ladder on YouTube views
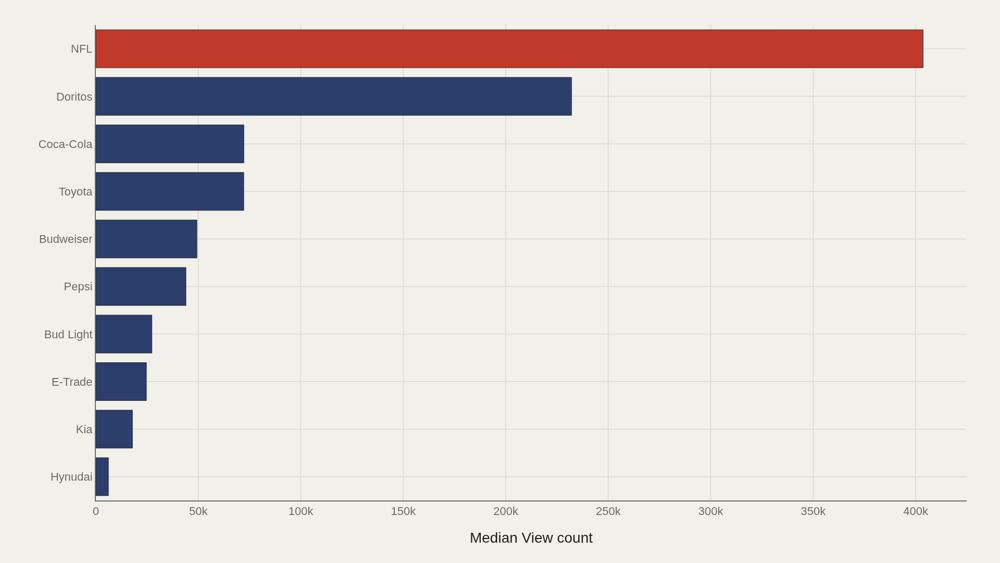
NFL leads the top-twelve brands at 403,641 views; the median within that group sits at 46,661. Doritos remains the top brand in the full-file aggregation; the chart isolates the highest performers in this particular cut. The gap between #1 and the top-dozen median shows how quickly the ladder drops. A few brands own the conversation; most of the competitive set operates closer to tens of thousands than hundreds of thousands.
Almost everything in the file is a YouTube video
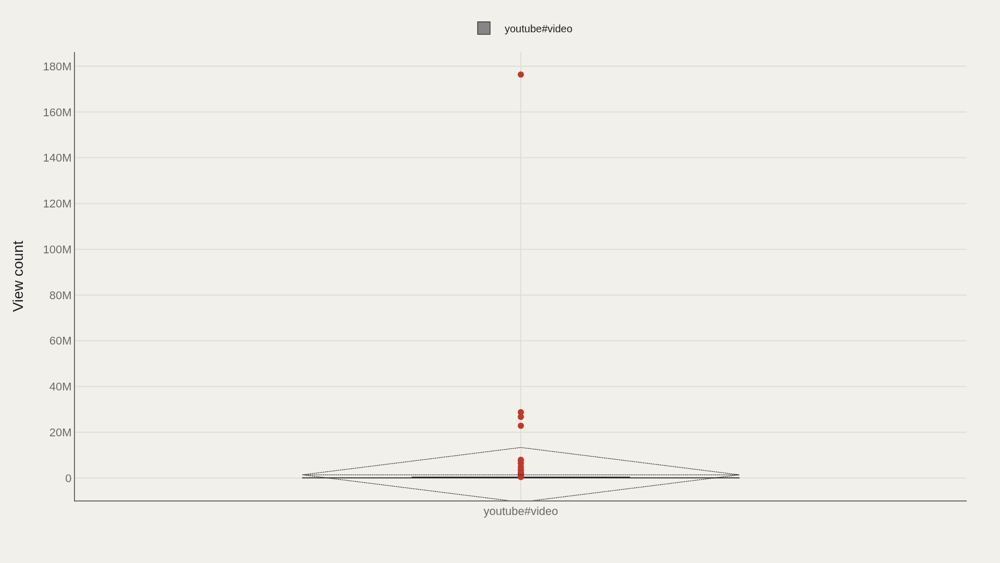
Splitting view count by format produces a near-monoculture: youtube#video is the dominant kind. The distribution confirms the archive's platform identity rather than revealing contested formats. This matters for scope. The dataset tracks post-game internet lives of Super Bowl ads on YouTube, not a complete census of every commercial that aired during the broadcast.
Five brands hold eighty-seven percent of aggregate views
The top five brands account for 87% of aggregate views—a steep Pareto curve. Post-game attention is not distributed evenly; a small group drives the bulk of summed engagement. Concentration at this level explains why brand strategy obsesses over a handful of breakthrough spots. The long tail exists but does not move the aggregate the way the head does.
Views and likes travel together — with clusters
Plotting view count against like count reveals clusters that a single correlation coefficient would obscure. Some ads convert attention into likes efficiently; others accumulate views without the same approval signal. The scatter maps how the two engagement measures co-move in this 247-row extract, not a quality ranking.
What to take away
Post-game Super Bowl attention is concentrated: median views sit at 41,379, the ceiling reaches 176,373,378, and five brands capture 87% of aggregate views.
The falling median from 111,814 to 33,766 reflects archive expansion, not declining ad quality. NFL and Doritos-scale leaders anchor the archive's memory. Views and likes move together in clusters, which is how engagement looks when a few spots become folklore and most settle into inventory.
■ END
The Fine PrintBack of the BoxEnd Credits
NoteWarningsDisclaimer
Artometrics data brief. Figures come from the sources below. Derived shares and editorial indices are not audited financials.
SourcesContentsSources
MethodAssemblyMethod
Numbers in this issue are the published figures. The skin changes type, rules, and chart color only.
PlatesMade byImage credits
- HeroArtometrics Super Bowl illustration.
- PlatePortrait of Luca Pacioli, attributed to Jacopo de' Barbari, c. 1495. Public domain, via Wikimedia Commons.
- PlateColor print of a toy shop, Utagawa Sadahide, 1860. The Metropolitan Museum of Art, CC0, via Wikimedia Commons.
- PlateBelasco Theatre box office, published November 1907 in Architects' and Builders' Magazine. Unknown photographer. Public domain, via Wikimedia Commons.


Updated through JUN 15, 2026.