



JUN 15, 2026 · Television
Television
Prestige TV Scores Drifted Up—Slowly—From 1990 to 2018
Median season ratings climbed from 7.86 to 8.15 across 2,266 records—a raised floor, not a sudden elite leap.
By Kyle McAuliffe · · 3 min

Median season ratings rose 0.29 points—from 7.86 to 8.15—between 1990 and 2018, raising the typical show's score without the sharp elite-vs-mediocrity split that golden-age rhetoric promised.
The working file holds 2,266 records from 1990–2018. Median average rating is 8.11; the highest observed average is 9.68. Parenthood leads the title ranking in the extract.
0.29
Point increase in median rating from 1990 to 2018—a raised floor, not a spike
8.11
Overall median rating across 2,266 season records—the typical row
8.79
Threshold for the top decile—where defining cases live
How the pattern changed over time
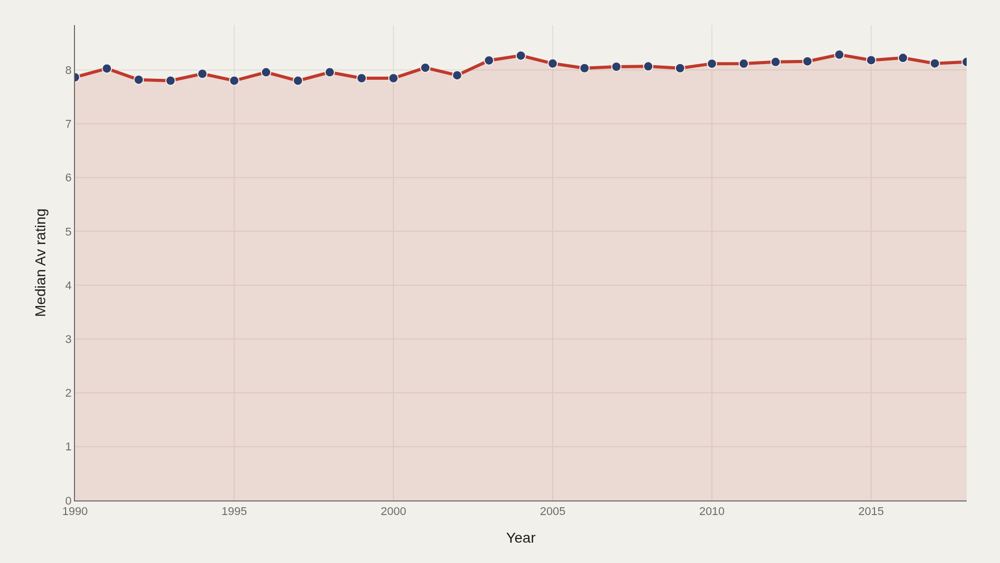
Median average rating rises from 7.86 in the opening period to 8.15 at the close—a 0.29-point climb that describes the typical row, not the headline cases. The middle of the scoreboard edged upward while prestige TV became a cultural brand. That is not the same shape as an explosion of elite outliers.
Who sits at the top
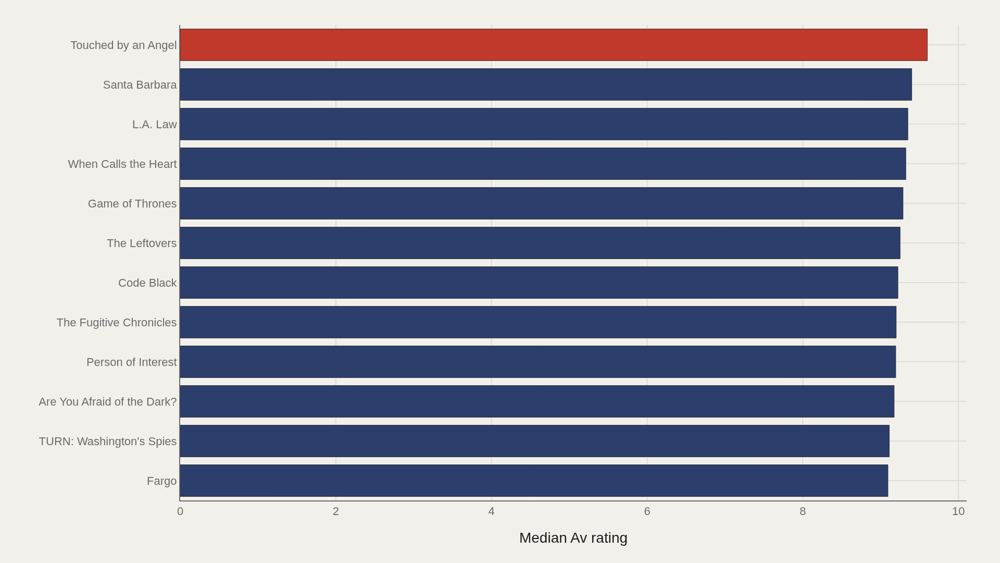
Touched by an Angel leads at 9.60; 9.24 marks the median among the top dozen. The head of the board is densely packed at the high end. High averages can reflect passionate rater pools as much as critical consensus. Read the leaders as the file's ceiling, then compare them to the 8.11 median that describes the typical row.
How the field is spread
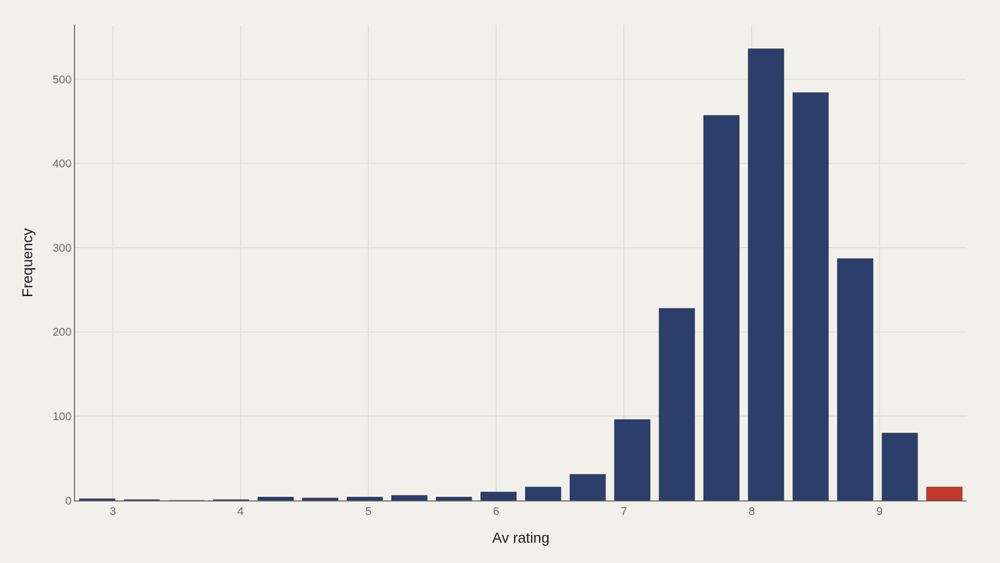
Median 8.11 versus mean 8.06—the shape is nearly symmetric. The top decile begins at 8.79; that tail is where defining cases live. A symmetric prestige-TV scoreboard contradicts the thin-elite-versus-wide-mediocrity story. The distribution is tighter than golden-age rhetoric suggests.
Leader Trends
Leading names do not move in lockstep—some fade as others surge. Tracking medians over time separates sustained dominance from one-off spikes. A peak season is not the same data shape as a long plateau above 8.
What moves together
Average rating and season number show clusters that a single summary would erase—early-season highs, late-season drift, and shows that hold the middle across many seasons. Longevity and quality are related but not identical. The scatter is where that distinction becomes visible.
What to take away
The median climbed 0.29 points—from 7.86 to 8.15—while the overall middle stayed near 8.11. A raised floor, not a sudden leap. Leaders near 9.6 and a top decile from 8.79 show how much room remains above the typical row.
Read trends, distribution, and season scatter together before treating any single title as proof that critics and audiences agreed.
■ END
The Fine PrintBack of the BoxEnd Credits
NoteWarningsDisclaimer
Artometrics data brief. Figures come from the sources below. Derived shares and editorial indices are not audited financials.
SourcesContentsSources
MethodAssemblyMethod
Numbers in this issue are the published figures. The skin changes type, rules, and chart color only.
PlatesMade byImage credits
- HeroArtometrics Television illustration.
- PlatePortrait of Luca Pacioli, attributed to Jacopo de' Barbari, c. 1495. Public domain, via Wikimedia Commons.
- PlateColor print of a toy shop, Utagawa Sadahide, 1860. The Metropolitan Museum of Art, CC0, via Wikimedia Commons.
- PlateBelasco Theatre box office, published November 1907 in Architects' and Builders' Magazine. Unknown photographer. Public domain, via Wikimedia Commons.


Updated through JUN 15, 2026.