



JUN 15, 2026 · Tuition
Tuition
Vermont Led Public Tuition at $13,486 as Medians Rose 56%
Median state tuition climbed from $5,876 to $9,141 across 2004–2015; Vermont led at $13,486 while five states held 38% of aggregate value.
By Kyle McAuliffe · · 3 min
Median state tuition rose from $5,876 in 2004 to $9,141 in 2015—a 56% increase—across 600 state-year observations. Vermont led at $13,486, the top decile began at $11,204, and five states held 38% of aggregate tuition value.
The median of $7,607 anchors the distribution. Vermont's lead, the climb from baseline to close, and the $11,204 top-decile threshold all measure distance from that center.
$5,876→$9,141
Median tuition rose 56% over 2004–2015
$13,486
Vermont led all states in average tuition
$11,204
Top-decile threshold; only 10% of observations exceeded this level
Median tuition climbed from the mid-five-thousands to the low-nine-thousands
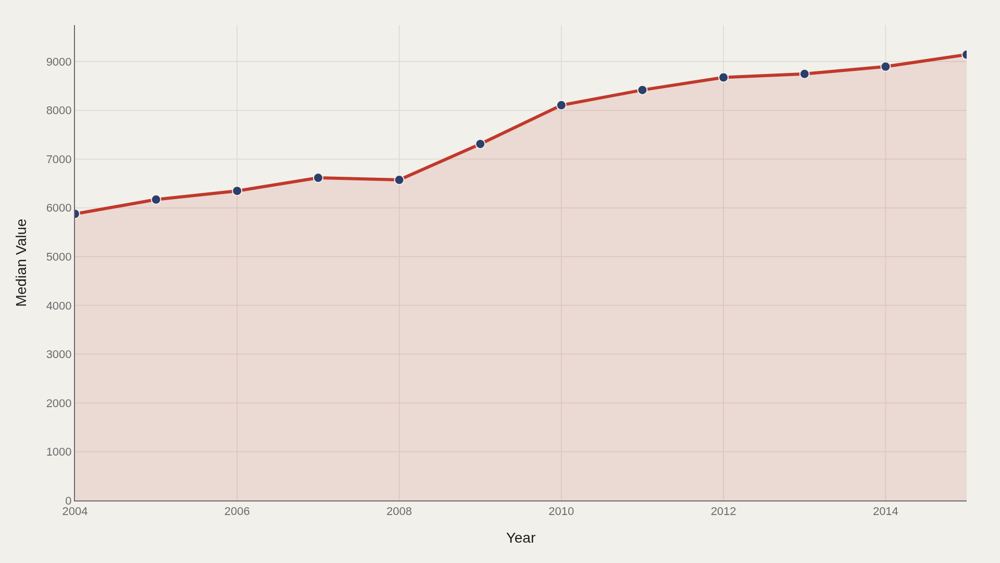
Median tuition rose from $5,876 in 2004 to $9,141 in 2015. The typical state moved upward across the period, and no year showed a reversal. A rising median signals shared experience. High-cost states amplify the climb; low-cost states still participate in the upward shift.
Vermont leads the state ladder in the charted cut
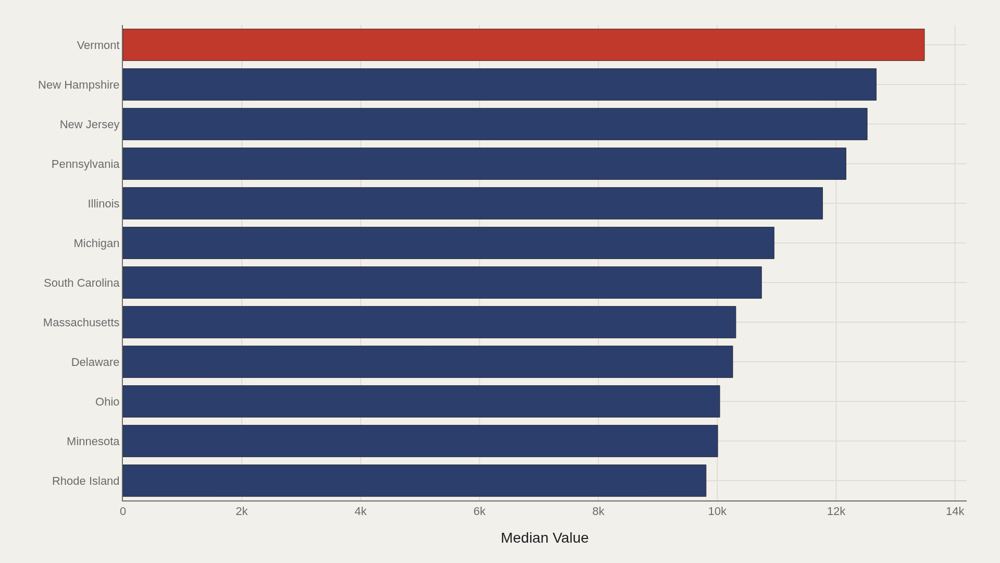
Vermont leads at $13,486; the median among the top dozen states is $10,850. New Hampshire ranks second in the fact-box summary; the leaders chart shows the full numeric ladder. The gap from first place to the top-dozen median confirms a competitive but elevated upper tier—expensive relative to the file median of $7,607.
Median and mean sit close; the top decile starts above eleven thousand
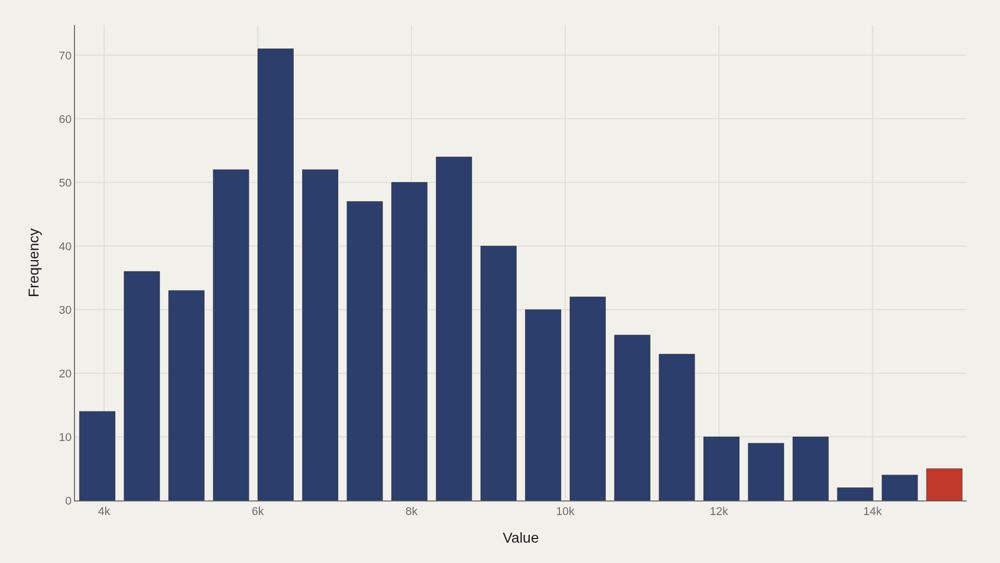
Median $7,607 versus mean $7,899—the distribution is relatively symmetric for a price series. The top decile begins at $11,204; high-tuition states occupy that upper slice. Near-symmetry at the center does not erase the expensive tail. It confirms the typical state is not distorted by extreme outliers in the average.
Leading states do not move in lockstep over time
Leader trajectories diverge—some states fade while others surge. Tracking medians over time separates sustained high-price states from one-off spikes. Side-by-side paths matter when the policy question is whether expensive states stay expensive or the ladder reshuffles.
Five states account for thirty-eight percent of aggregate value
The top five state entries account for 38% of aggregate tuition value. Concentration is meaningful without being absolute: a visible head and a broader set of states carrying most of the remaining total. Pareto steepness reminds us that national tuition debates often orbit a minority of high-cost states even when the median tells a quieter story.
What to take away
State tuition rose from $5,876 to $9,141 at the median, centered on $7,607, with an expensive tail beginning at $11,204 in the top decile.
Vermont led at $13,486, five states held 38% of aggregate value, and leader trajectories diverged—a price map of public higher education's mid-2000s to mid-2010s climb.
■ END
The Fine PrintBack of the BoxEnd Credits
NoteWarningsDisclaimer
Artometrics data brief. Figures come from the sources below. Derived shares and editorial indices are not audited financials.
SourcesContentsSources
MethodAssemblyMethod
Numbers in this issue are the published figures. The skin changes type, rules, and chart color only.
PlatesMade byImage credits
- HeroArtometrics Tuition illustration.
- PlatePortrait of Luca Pacioli, attributed to Jacopo de' Barbari, c. 1495. Public domain, via Wikimedia Commons.
- PlateColor print of a toy shop, Utagawa Sadahide, 1860. The Metropolitan Museum of Art, CC0, via Wikimedia Commons.
- PlateBelasco Theatre box office, published November 1907 in Architects' and Builders' Magazine. Unknown photographer. Public domain, via Wikimedia Commons.


Updated through JUN 15, 2026.