



JUN 15, 2026 · Voters
Voters
National Turnout Hit 132 Million; Most States Stayed Near 1.2 Million
National turnout reached 132.6 million in 2014 while the median state recorded 1.17 million votes across 936 elections from 1980–2014.
By Kyle McAuliffe · · 3 min
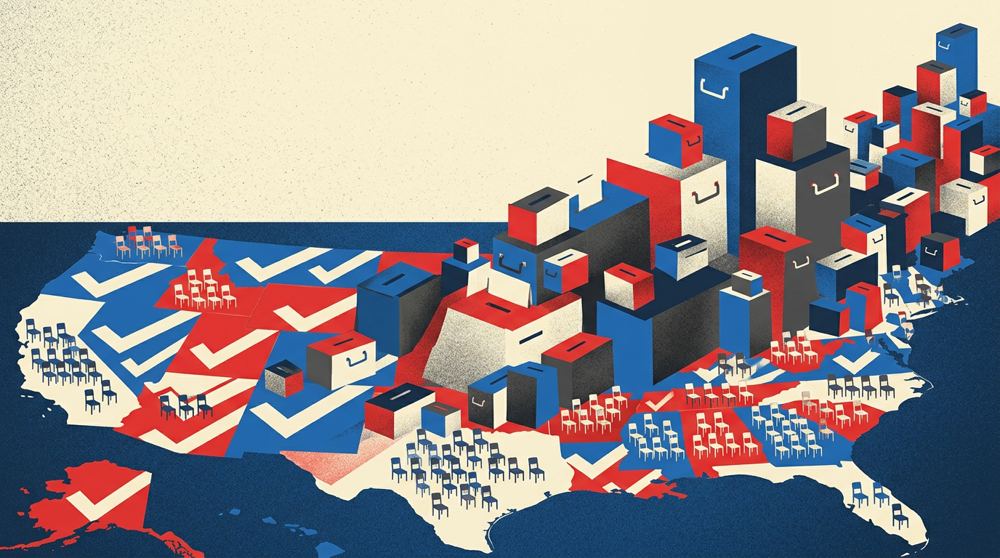
National turnout reached 132,609,063 in 2014 while the median state recorded 1,170,867 votes, according to 936 election records from 1980–2014. The national aggregate appears as a separate entity in the dataset, sitting 113 times higher than the typical state.
Five charts separate trend, leaders, distribution shape, state trajectories, and the relationship between votes cast and eligible voters. The median of 1,170,867 divides smaller states below from larger electorates and national totals above.
132,609,063
Peak national turnout in 2014 — 113× the median state
1,170,867
Median state turnout — below mean of 3,074,280 due to right skew
52%
Rise in median state turnout from 910,290 (1980) to 1,387,622 (2014)
Median votes rose across three decades of elections
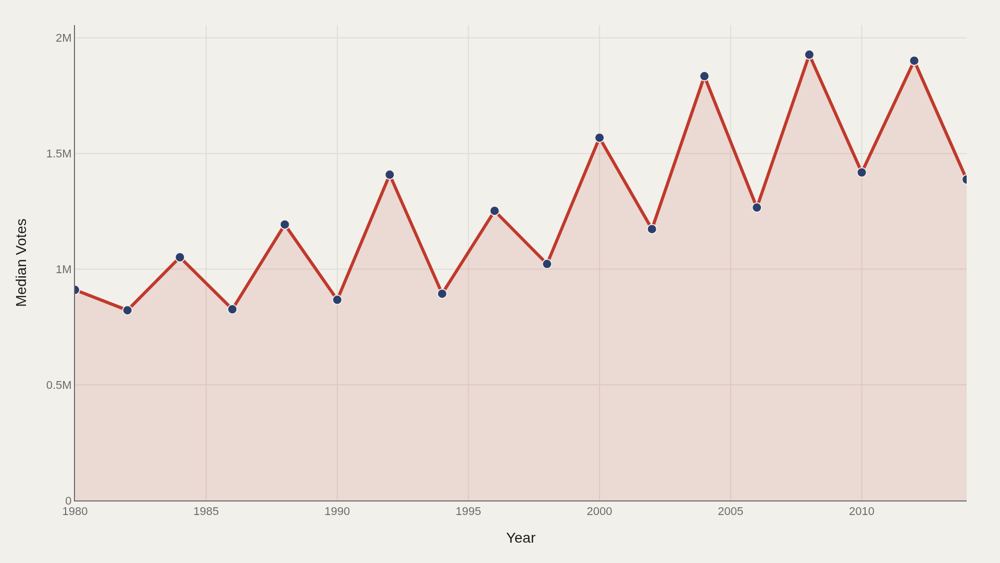
Median state turnout rose 52% from 910,290 in 1980 to 1,387,622 in 2014. Population growth, eligibility expansion, and election-type composition all contribute to the upward trend. The rising median provides context for state-level comparisons: leader states and national totals amplify the trend, while smaller jurisdictions track within the shifting distribution.
The United States total dwarfs the state ladder
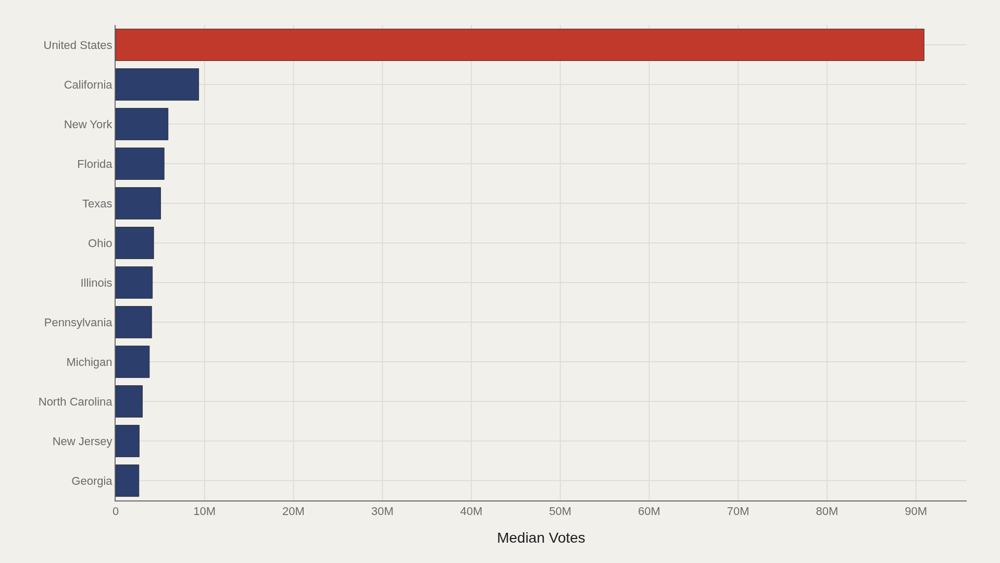
The national aggregate averages 90,912,015 votes across the period, while the median among the top dozen states sits at 4,209,538. The national row represents the sum of all state turnout, not a peer comparison. The peak of 132,609,063 reflects this national-scale aggregation. Individual state rankings occur far below that ceiling.
A right-skewed distribution with a heavy upper tail
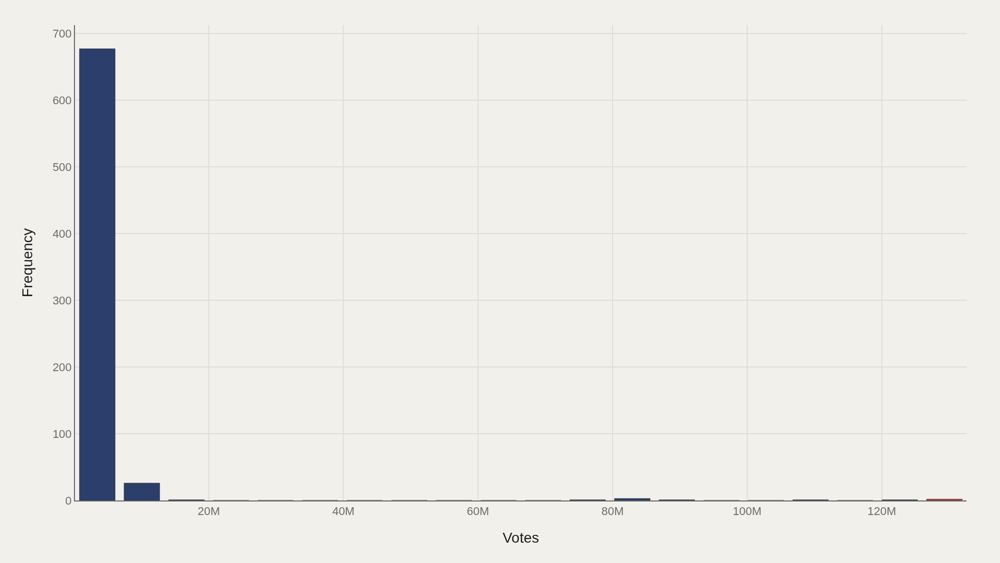
Median state turnout of 1,170,867 sits below the mean of 3,074,280 because large states and national totals create a long right tail. The top decile begins at 4,659,000, separating high-volume states from the rest. Right skew explains why turnout analysis requires medians and rates rather than raw averages alone.
Leading states reshuffle across election cycles
State trajectories diverge over time: some maintain high turnout while others surge or fade. Tracking individual states separates sustained volume from cycle-specific spikes. Presidential versus midterm composition within the dataset can shift the state ladder even when the overall median rises.
Votes scale with eligible voters — in clusters
Votes cast rise with eligible-voter pools, but the scatter plot reveals clusters that averages obscure. Larger eligibility produces larger turnout, yet the pattern's texture shows variation in how tightly that relationship holds across states and years. The joint distribution captures turnout as a rate problem without requiring a calculated rate column: eligibility and votes move together, and the clusters show where exceptions occur.
What to take away
Median state turnout rose 52% from 910,290 to 1,387,622 between 1980 and 2014, while the national aggregate reached 132,609,063 at its peak. Vote totals are right-skewed around the median of 1,170,867, with the top decile beginning at 4,659,000.
State rankings shift across election cycles, and votes track eligible-voter pools in clusters — a volume atlas of American elections across 35 years.
■ END
The Fine PrintBack of the BoxEnd Credits
NoteWarningsDisclaimer
Artometrics data brief. Figures come from the sources below. Derived shares and editorial indices are not audited financials.
SourcesContentsSources
MethodAssemblyMethod
Numbers in this issue are the published figures. The skin changes type, rules, and chart color only.
PlatesMade byImage credits
- HeroArtometrics Voters illustration.
- PlatePortrait of Luca Pacioli, attributed to Jacopo de' Barbari, c. 1495. Public domain, via Wikimedia Commons.
- PlateColor print of a toy shop, Utagawa Sadahide, 1860. The Metropolitan Museum of Art, CC0, via Wikimedia Commons.
- PlateBelasco Theatre box office, published November 1907 in Architects' and Builders' Magazine. Unknown photographer. Public domain, via Wikimedia Commons.


Updated through JUN 15, 2026.