



APR 18, 2026 · Warriors
Warriors
Seventy-Three Wins Rewrote Basketball Offense
Golden State won 73 games in 2015–16, launched 15 more threes per game than the league, and changed how every franchise builds offense.
By Kyle McAuliffe · · 5 min

Golden State won 73 games in 2015–16—the most in NBA history—and by that season were attempting 14.9 more threes per game than the league average. Within a decade, every franchise copied the strategy.
73
Regular season wins in 2015–16 — broke the Bulls' 72-win record and remains the NBA ceiling
14.9
Three-point attempt gap over league average in 2015–16 — the Warriors launched 41.6 per game while the NBA averaged 26.7
3,747
Career three-pointers by Stephen Curry through 2024 — 700+ more than any player in NBA history
Two dynasty windows, and a desert between them
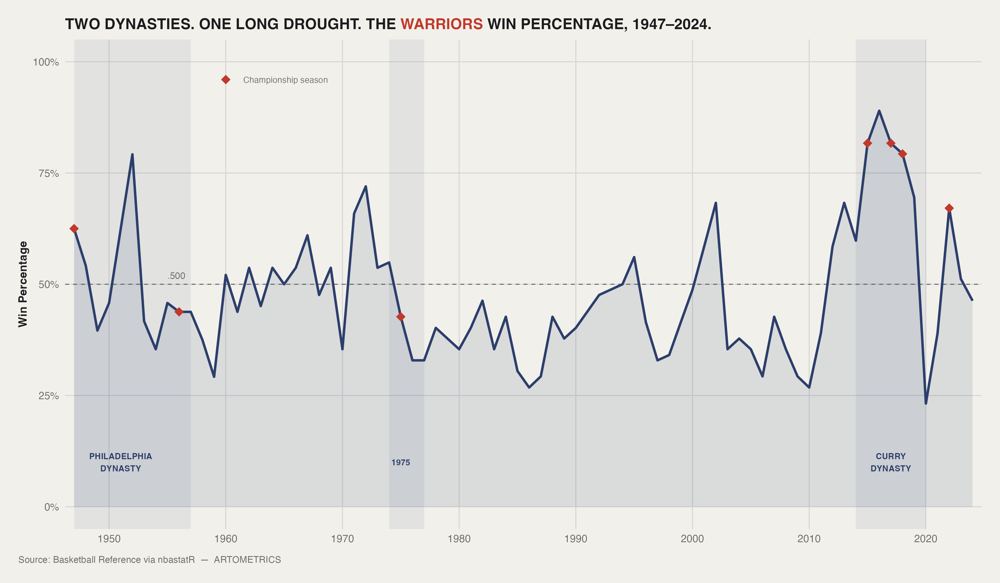
The Warriors have had exactly two dynasty windows in 78 years. The Philadelphia era—anchored by the 1947 and 1956 championships—produced the first sustained run, though several seasons hovered in the 40–45% win range even then. The 1975 title was a one-season outlier: a Rick Barry-led peak at .720, then a collapse back into irrelevance. What follows is 35 consecutive seasons below or hovering at .500, interrupted only by the We Believe playoff run in 2007 and a few Mullin–Hardaway winning years in the early 1990s. The Curry era is categorically different. From 2015 through 2019, the Warriors never won fewer than 57 games in a non-strike-shortened season—five consecutive years above .695, unmatched in the modern NBA. The 2015–16 spike to .890 is the visual anchor. The 2019–20 collapse—from .707 to .232, a 47-point drop after Klay Thompson's ACL tear and a COVID-shortened season—is the steepest single-season fall in franchise history. The 2022 championship rebound, from .232 to .671 in two seasons without a lottery pick or blockbuster trade, is the fastest recovery in the dataset.
How one franchise forced the league to relearn offense
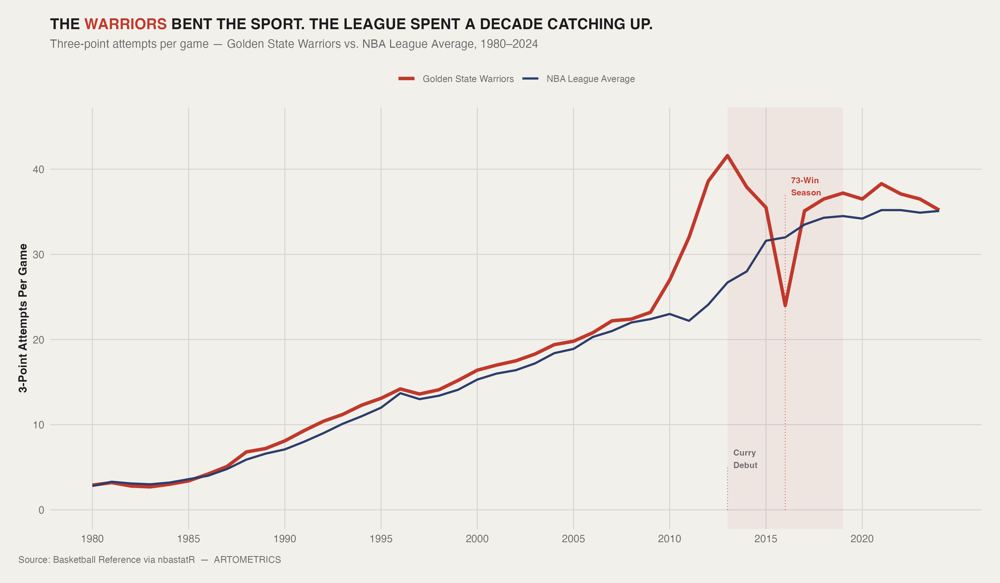
From 1980 through 2012, Golden State shot about as many threes as everyone else. The lines run almost on top of each other for three decades—not because the Warriors were average in talent, but because no team yet treated the three-point line as basketball's central structural advantage. A shot worth 50% more than a two did not need a mathematician; it needed Curry. Divergence starts in 2013 and accelerates immediately. By 2015–16—the 73-win season—the Warriors launched 41.6 threes per game while the league averaged 26.7, a 14.9-attempt gap. They were attempting more threes per game than the entire NBA would average five years later. The 2017–2019 dip in volume is Kevin Durant, not retreat: easier scoring closer to the rim let Steve Kerr pull volume without sacrificing efficiency. After 2019, the league does not retreat when the dynasty wobbles—it accelerates. By 2022 the NBA average hit 35 attempts per game and Golden State's advantage had evaporated. Competitive diffusion: one franchise proves a thesis, wins four titles doing it, and within a decade the sport reorganizes around the same idea.
Six teams reached 68 wins. Only one owns 73.
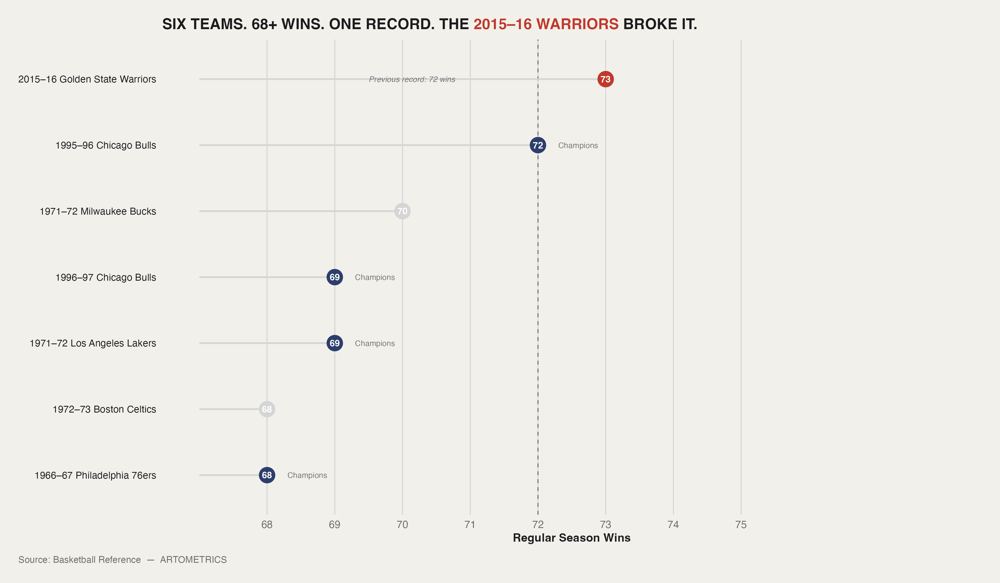
Only six teams in NBA history have won 68 or more regular-season games. The cluster at 68 and 69 is the ordinary ceiling of greatness. The 1995–96 Bulls sat alone at 72 for nearly two decades. Then Golden State broke the mark by one. Winning 73 games did not produce a championship. The 2015–16 Warriors lost the Finals to LeBron James and Cleveland in seven games—the first Finals team to blow a 3–1 lead. Of the six seasons on this chart, only the Warriors and the 1971–72 Bucks failed to win the title in their record year. The 73-win season is simultaneously the greatest regular season in NBA history and the most famous failure to close. The dynasty is correctly measured by four titles—2015, 2017, 2018, 2022—not by any single win total. The record year shows the Death Lineup ceiling. The legacy rests on what they built around Curry, Thompson, and Draymond Green after Durant left, after injuries piled up, after the window was supposed to be closed.
What the charts leave open
Chart 1's win percentages come from a manually verified Basketball Reference tibble rather than a live multi-season API pull; values match the published record, but replication is safest via nbastatR with single-season calls to avoid scraper rate limits. Chart 2 cannot show pre-1979 shooting philosophy because the three-point line did not exist; the "revolution" claim is bounded to that 44-year window. Pre-Curry Warriors volume (1980–2012) tracks the league more by coincidence than design.
■ END
The Fine PrintBack of the BoxEnd Credits
NoteWarningsDisclaimer
Artometrics data brief. Figures come from the sources below. Derived shares and editorial indices are not audited financials.
SourcesContentsSources
- SourceBasketball Reference. (2024). Golden State Warriors franchise history. Sportradar. Retrieved from https://www.basketball-reference.com/teams/GSW/
- SourceBasketball Reference. (2024). NBA season summaries, 1979–2024. Sportradar. Retrieved from https://www.basketball-reference.com/leagues/
- SourceBresler, A. (2023). nbastatR: An interface to the NBA Stats API, Basketball Reference, and related sources (R package version 0.1.153). GitHub. Retrieved from https://github.com/abresler/nbastatR
- SourceGoldsberry, K. (2019). Sprawlball: A visual tour of the new era of the NBA. Houghton Mifflin Harcourt.
- SourceLewis, M. (2004). Moneyball: The art of winning an unfair game. W. W. Norton & Company.
- SourceOliver, D. (2004). Basketball on paper: Rules and tools for performance analysis. Potomac Books.
- SourceShea, S., & Baker, C. (2013). Basketball analytics: Objective and efficient strategies for understanding how teams win. Advanced Metrics.
- SourceSilver, N. (2015, June 11). The Warriors' three-point revolution and how it changed basketball. FiveThirtyEight. Retrieved from https://fivethirtyeight.com
- SourceRelated Artometrics report: Celtics
- SourceRelated Artometrics report: Lakers
- SourceRelated Artometrics report: Giants
- ReportFull report: artometrics.com/warriors
MethodAssemblyMethod
Numbers in this issue are the published figures. The skin changes type, rules, and chart color only.
PlatesMade byImage credits
- HeroArtometrics Warriors illustration.
- PlatePortrait of Luca Pacioli, attributed to Jacopo de' Barbari, c. 1495. Public domain, via Wikimedia Commons.
- PlateColor print of a toy shop, Utagawa Sadahide, 1860. The Metropolitan Museum of Art, CC0, via Wikimedia Commons.
- PlateBelasco Theatre box office, published November 1907 in Architects' and Builders' Magazine. Unknown photographer. Public domain, via Wikimedia Commons.


Updated through APR 18, 2026.