



JUN 15, 2026 · Water
Water
Singapore's Wastewater Plants Discharge 200× the Global Norm
Facility-level data show median discharge at 1,079 m³/day; Singapore's plants average 223,683.
By Kyle McAuliffe · · 4 min
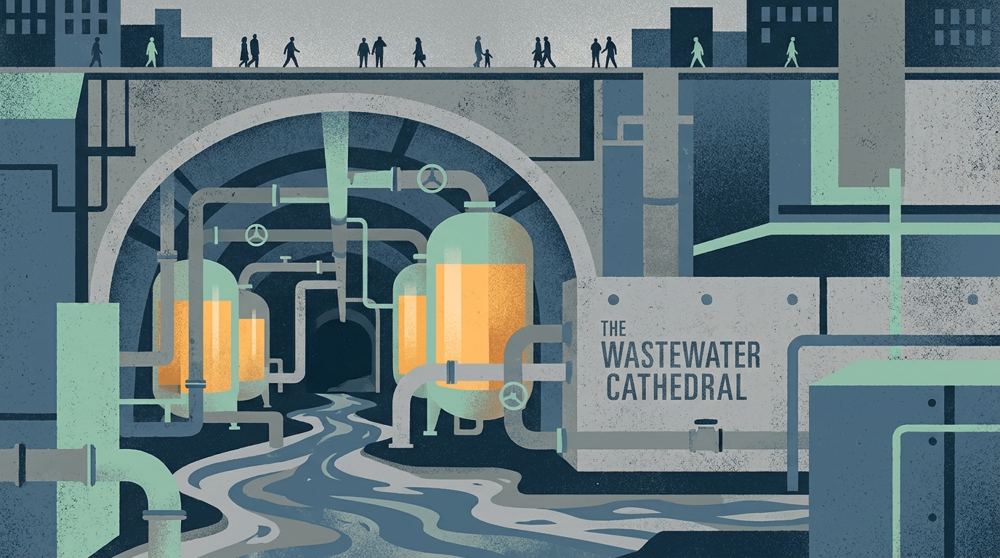
Median wastewater discharge across 58,502 facilities is 1,079 m³/day; Singapore's plants average 223,683, while one U.S. facility exceeds 3 million—a 2,800× spread that maps density, infrastructure investment, and the uneven geography of treatment reporting.
The TidyTuesday extract from September 2022 covers 58,502 plants worldwide. Median waste discharge (WASTE DIS) is 1,079 m³/day; the maximum exceeds 3,073,754. The United States leads aggregate discharge due to reporting volume, while Secondary treatment is the most common level label by count.
Scale without treatment tier is incomplete: a large plant with advanced filtration is a different civic asset from a large plant stuck at primary or secondary standards.
58,502
Facilities logged in the TidyTuesday extract, covering operational and proposed plants worldwide
1,079
Median discharge in m³/day; the top recorded plant exceeds 3 million
223,683
Singapore's average plant discharge, 207× the global median and highest among recorded countries
Discharge by country
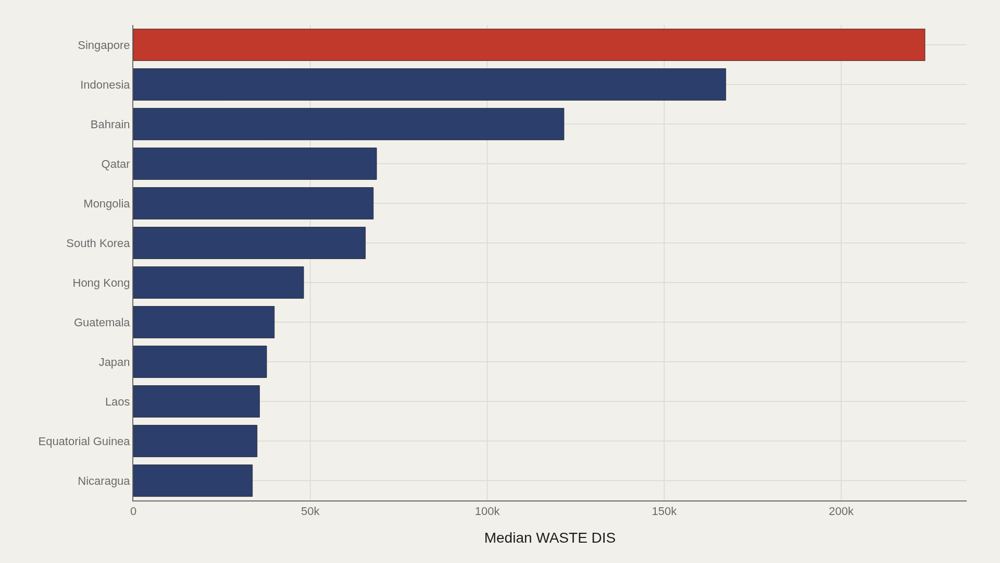
Country rollups place high-intensity systems in view. Singapore leads near 223,683 m³/day on average plant discharge, while Nicaragua sits near 33,649—a reminder that averages mix plant size, urban concentration, and reporting coverage. The United States leads aggregate discharge by facility count, not per-plant intensity. Large federations with many logged plants dominate totals even when median plants elsewhere run bigger.
Who sits at the top
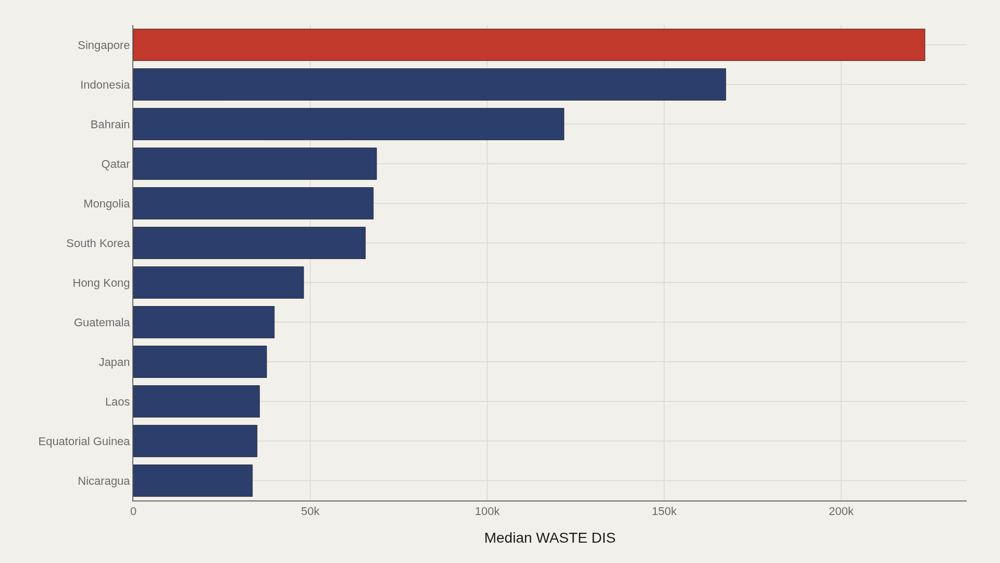
Among the top dozen countries by intensity, Singapore leads at 223,683 m³/day, and the median of that group is 56,849—far above the file-wide median of 1,079. Dense city-states and highly instrumented reporting systems rise on these lists. The ranking reflects what gets measured and attributed as much as what flows through pipes.
Treatment levels spread discharge
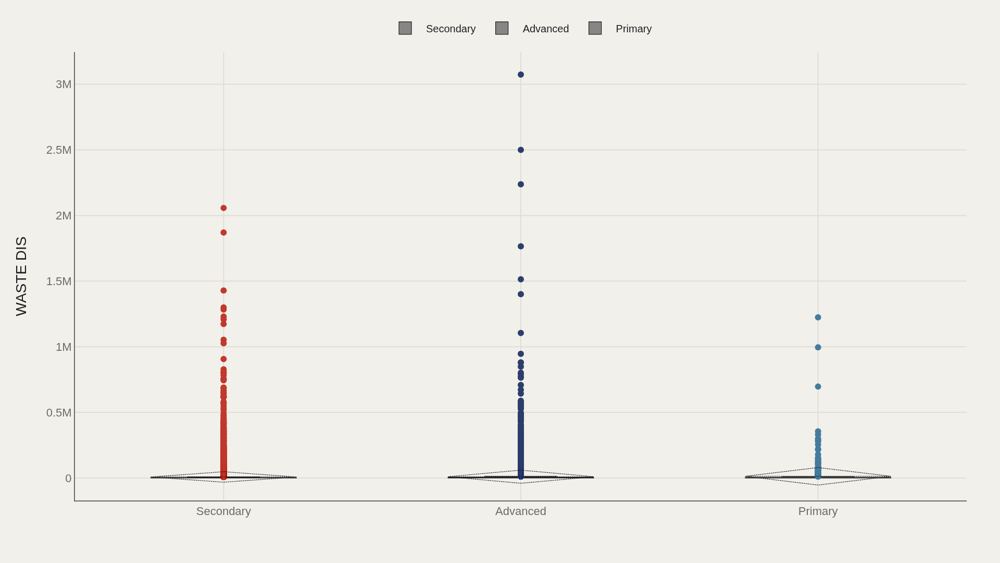
Category boxes by treatment level—secondary, advanced, and related labels—show whether discharge norms are shared or split across tiers. Secondary dominates headcount; advanced plants can dominate intensity. The civic stakes: upgrading level without changing plant counts can shift environmental outcomes more than building another median-sized secondary facility.
Who beats the median — and who trails
Advanced treatment sits 681 m³/day above the median; Secondary trails by 342. The direction fits only if advanced plants are often larger urban facilities, not merely cleaner ones. Level labels encode technology and city scale. Reading the gap as a pure quality ranking without plant-size context overfits the moral and underfits the engineering.
Discharge and quality fields
Plotting waste discharge against quality scores reveals clusters that averages erase. Some plants combine high discharge with strong quality marks; others pair modest discharge with weaker flags. The scatter is where big and good stop being synonyms. Infrastructure policy needs both axes: capacity to serve population, and treatment quality sufficient for receiving water.
What to take away
Wastewater is a skewed industry: median discharge near 1,079 m³/day, extremes above three million, and country totals dominated by large reporting systems such as the United States.
The citable distinction is treatment level versus size. Secondary is common; advanced sits 681 m³/day above the median; quality and discharge together decide whether a plant is merely large or actually protective.
■ END
The Fine PrintBack of the BoxEnd Credits
NoteWarningsDisclaimer
Artometrics data brief. Figures come from the sources below. Derived shares and editorial indices are not audited financials.
SourcesContentsSources
- SourceThe source is the TidyTuesday release from 2022-09-20 (R for Data Science community). The working file contains 58,502 rows and 25 columns after merging country, treatment level, discharge, and quality fields.
- ReportFull report: artometrics.com/wastewater
MethodAssemblyMethod
Numbers in this issue are the published figures. The skin changes type, rules, and chart color only.
PlatesMade byImage credits
- HeroArtometrics Water illustration.
- PlatePortrait of Luca Pacioli, attributed to Jacopo de' Barbari, c. 1495. Public domain, via Wikimedia Commons.
- PlateColor print of a toy shop, Utagawa Sadahide, 1860. The Metropolitan Museum of Art, CC0, via Wikimedia Commons.
- PlateBelasco Theatre box office, published November 1907 in Architects' and Builders' Magazine. Unknown photographer. Public domain, via Wikimedia Commons.


Updated through JUN 15, 2026.