



JUN 15, 2026 · Wealth
Wealth
Middle Brackets Gained Income Share; Top Tiers Trailed the Median
Middle income groups claimed 16% more share; top earners held 6.7 points less than the 10.9% median between 1967 and 2019.
By Kyle McAuliffe · · 4 min

Middle-income households captured a larger slice of total income than the median, while top earners held less. Across 2,916 Census records from 1967 to 2019, the median income share was 10.9%; households earning $50,000–$74,999 sat 6.6 points above that mark, and those earning $150,000–$199,999 trailed by 6.7 points.
The data track how the median drifted, which race categories led, how each dollar bracket compared to the center, and how income share correlated with median household income. The calibration point is 10.9% — the midpoint of the share field in this extract.
2,916
Census records covering 52 years of household income distribution
10.9%
Median income share across all brackets and race categories
6.6 points
How far middle brackets ($50,000–$74,999) exceeded the median
The median income-distribution marker drifted upward
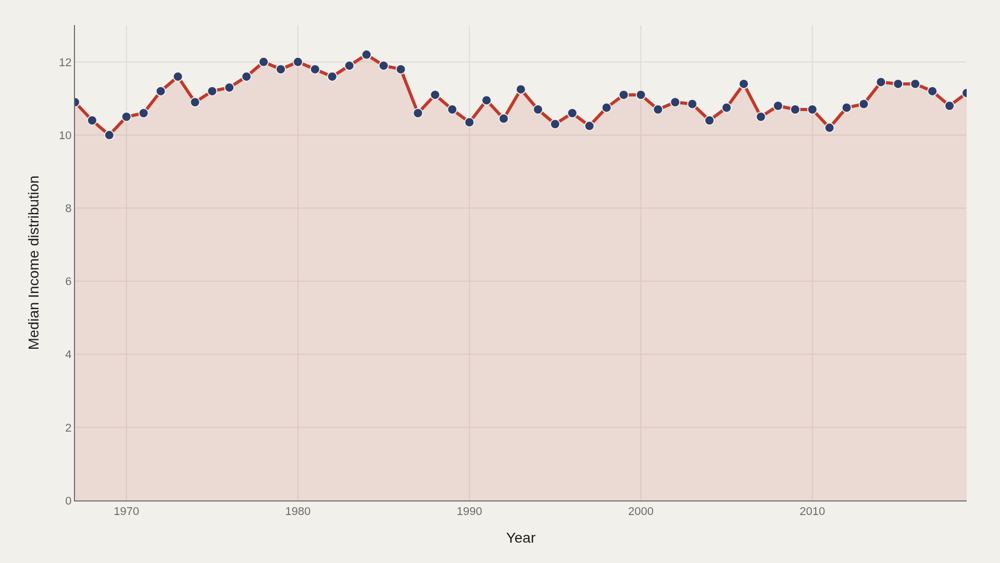
Median income distribution rose from 10.9 in the opening period to 11.2 at the close — a 0.3 percentage-point increase across the 52-year window. The center of this field moved higher, though not by orders of magnitude. Modest median drift can coexist with large bracket-level gaps. The trend chart reports the center; the gap chart reports the structure underneath.
Hispanic (Any Race) leads the charted race ladder
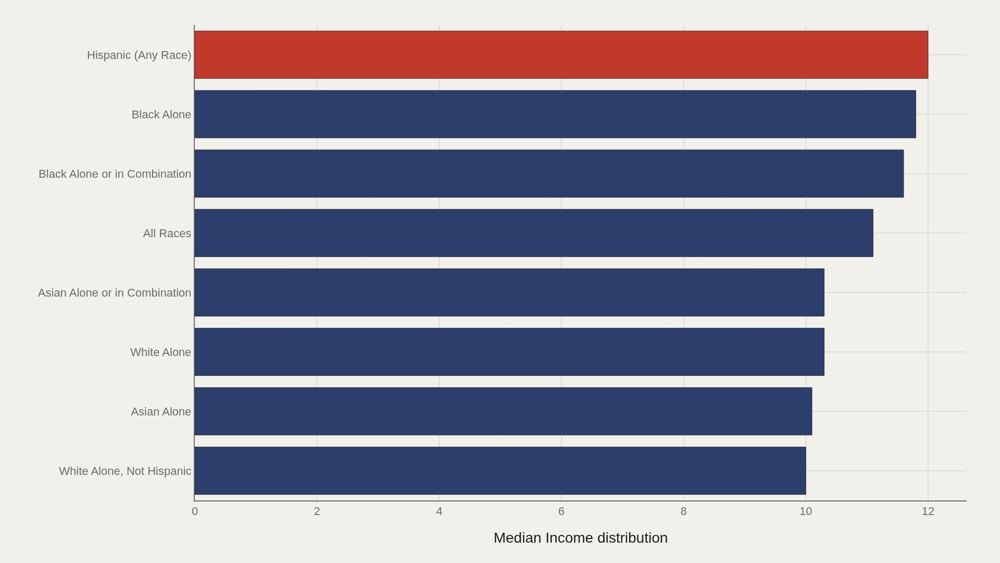
Hispanic (Any Race) leads at 12.0, while 10.7 marks the median among the top dozen race categories in this cut. Black Alone remains a fact-box landmark for the ranking rule used there; the leaders chart makes the numeric top of this aggregation explicit. The ladder is tight near the center of the file — leaders sit close to the overall median of 10.9 rather than in a different statistical universe.
Income brackets carve different distribution bands
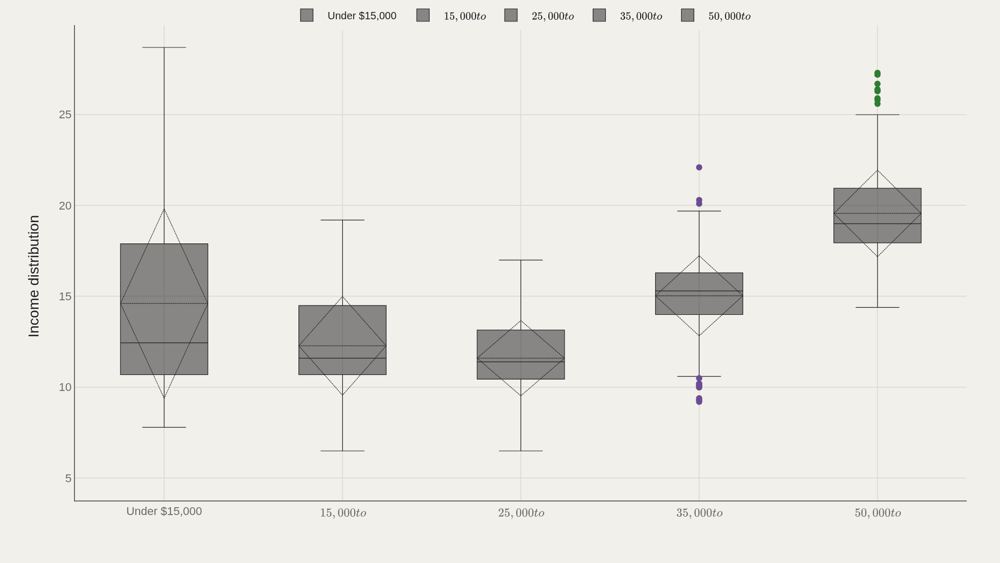
Category boxes by income bracket show whether the income-distribution field is shared or contested across dollar bands. Under $15,000 is the most common bracket label by frequency; the boxes ask how the metric spreads inside each band. Bracket structure is the skeleton of inequality analysis in this file. A single median of 10.9 hides those band-level differences.
Mid brackets clear the median; high brackets trail in this cut
$50,000 to $74,999 sits 6.60 above the median; $150,000 to $199,999 trails by 6.70. Those signed gaps are among the starkest bracket contrasts in the extract. Trailing or leading the median here is a statement about the income-distribution field's values by bracket, not a casual claim about who is "richer" in narrative terms. Cite the signed distances as structural offsets.
Distribution values and income medians form joint clusters
Plotting income distribution against income median shows clusters that averages erase. Race-year points co-locate in patterns that a single summary cannot hold. The scatter is relational: it shows how the two income fields move together across the 1967–2019 extract.
What to take away
Income distribution in this file centers on 10.9, edges up to 11.2 at the median, and still shows sharp bracket gaps — mid bands above the median, top dollar bands trailing in this metric's signed distances.
Race ladders and the distribution–median scatter add group and joint structure. Together they map concentration and composition without reducing fifty years of income data to a single slogan.
■ END
The Fine PrintBack of the BoxEnd Credits
NoteWarningsDisclaimer
Artometrics data brief. Figures come from the sources below. Derived shares and editorial indices are not audited financials.
SourcesContentsSources
MethodAssemblyMethod
Numbers in this issue are the published figures. The skin changes type, rules, and chart color only.
PlatesMade byImage credits
- HeroArtometrics Wealth illustration.
- PlatePortrait of Luca Pacioli, attributed to Jacopo de' Barbari, c. 1495. Public domain, via Wikimedia Commons.
- PlateColor print of a toy shop, Utagawa Sadahide, 1860. The Metropolitan Museum of Art, CC0, via Wikimedia Commons.
- PlateBelasco Theatre box office, published November 1907 in Architects' and Builders' Magazine. Unknown photographer. Public domain, via Wikimedia Commons.


Updated through JUN 15, 2026.