



OCT 12, 2026 · 140 FRANCHISES · $1,448.1B
Franchise · Data brief
Merchandise owns the ledger
What 140 franchises on Wikipedia’s October 2026 list say about IP, Disney and the sequel economy.
By Kyle McAuliffe · · 5 min
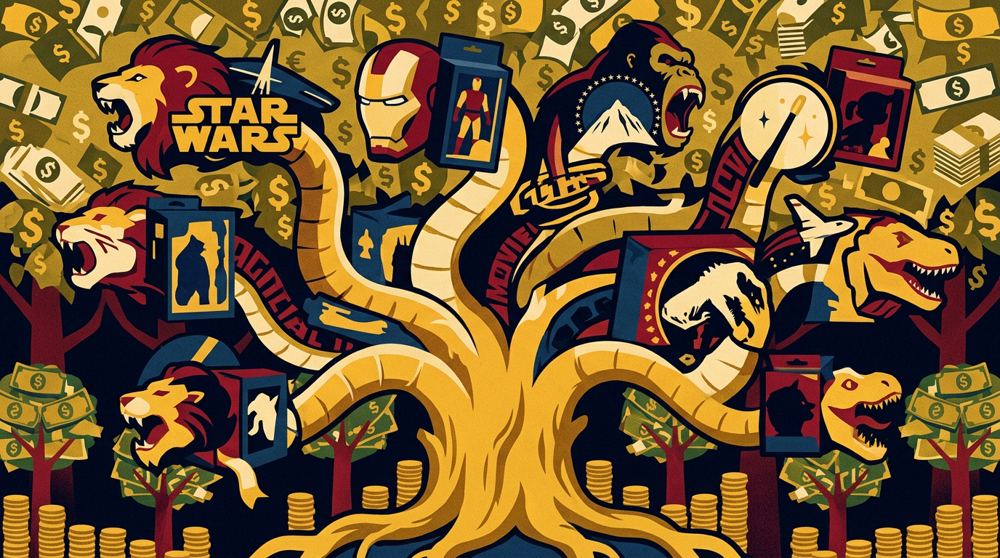
One ledger
A child trades a cardboard Pikachu for lunch money. Bob Iger signs a $71.3 billion check for 21st Century Fox. Both trades rest on the same premise: characters can be mined long after opening weekend.
Our x-ray is Wikipedia’s list of the highest-grossing media franchises as of October 12, 2026: 140 franchises, each split into revenue streams. Together they total $1,448.1 billion in lifetime revenue. These are editors’ estimates of consumer spending in nominal dollars, not audited studio financials. Still, it is the cleanest public ledger for comparing how money attaches to IP.
The cinema is the ad
- Merchandise 55.8%
- Box office 18.3%
- Video games 17.9%
- Other 8.0%
Merchandise, licensing and retail bring in $809.4 billion, or 55.8% of the ledger. Box office is 18.3% and video games 17.9%. At franchise scale, the theatrical release is usually marketing. The toys, cards and park tickets carry the money.
Box office looks twice as big as in the 2019 file (18.3% versus 8.9%), but that is mostly measurement: today’s list itemises film grosses more fully. Restricted to the 82 franchises in both years, it is 15.4%.
Pokémon, then everyone
Pokémon leads at $130.7 billion, of which $119.3 billion is retail sales. That is more than Star Wars and the Marvel Cinematic Universe combined ($84.2 billion). The anime promotes the cards; the cards promote the games. In the 2019 file Pokémon was $90.9 billion.
Five parents, 58%
58.2%
Assign each franchise to its 2026 parent company and Disney alone holds $430.7 billion, or 29.7% of the ledger. The top five (Disney, Warner Bros. Discovery, The Pokémon Company, Microsoft and Paramount Skydance) hold 58.2%. The previous edition put the top five at 46.4%; most of the rise is consolidation, such as Microsoft’s $69 billion Activision purchase in 2023.
Audited numbers tell the same story. Disney’s fiscal 2024 Form 10-K reports Experiences, its parks, cruises and consumer products, at $34.2 billion, against $41.2 billion for Entertainment. The characters promoted on screen get paid again at the turnstile. That is what the big checks bought: Pixar for $7.4 billion, Marvel for $4.0 billion, Lucasfilm for $4.05 billion.
The flip
The 2019 file said Japan out-earned the US. On the rebuilt ledger, US-origin franchises total $816.5 billion against Japan’s $394.5 billion. But Japan’s are the purer merchandise machines: 71.4% of their revenue comes from goods, against 52.0% for the US.
Two things moved. The list grew from 103 to 140 franchises, with many US additions such as Fortnite and Avatar. And several Japanese totals were revised down at the source: Hello Kitty fell from $80.0 billion to $33.5 billion, and Mario from $35.0 billion to $9.74 billion. Sanrio and Nintendo reported no collapse. Treat “the US out-earns Japan” as a fact about this English-language list, not about national industries.
Japan’s production committees explain part of the gap. They split copyright among publishers, broadcasters and toy makers, which builds plush, magazines and cards into the budget from day one.
A sequel chart
9 of 10
Nine of 2025’s ten biggest films worldwide were franchise installments, taking 94.4% of top-ten gross, led by Ne Zha 2 ($2.32 billion) and Zootopia 2 ($1.87 billion). F1 was the only original. 2026 is different so far: franchises hold 62.0%, with The Odyssey ($1.78 billion) and Michael ($1.03 billion) among the originals. Several 2026 titles are still in theaters.
For a buyer
Franchise economics rewards objects you can sell again and again more than minutes in a theater. So name the vintage, name the parent, and check whether a big move is a market change or just a source revision.
■ END
The Fine PrintBack of the BoxEnd Credits
NoteWarningsDisclaimer
Figures are Wikipedia editors' estimates of consumer spending in nominal dollars, not audited studio financials. “The US out-earns Japan” is a fact about this English-language list, not about national industries. Several Japanese totals were revised at the source (Hello Kitty $80.0B to $33.5B; Mario $35.0B to $9.74B); Sanrio and Nintendo reported no collapse.
SourcesContentsSources
- SourceWikipedia, List of highest-grossing media franchises, rev. 1379832186, Oct 12 2026 (S017).
- SourceTidyTuesday, Media Franchise Revenues, 2019-07-02 (S001).
- SourceWikipedia, 2025 in film (rev. 1378645325) and 2026 in film (rev. 1379926625), citing Box Office Mojo and The Numbers.
- SourceHernández Hernández, Á. D. (2018). Production committees. Arts 7(3): 42.
- SourceThe Walt Disney Company, Form 10-K FY2024, segment revenues (S004, S081).
- SourceFull report, methods and data: artometrics.com/franchise · repo folder.
- SourceWikipedia. List of highest-grossing media franchises — revision 904026364, 2019-06-29 (audit of S001); revision 1379832186, 2026-10-12 (primary ledger, S017). Accessed 2026-10-12.
- SourceWikipedia. 2025 in film (rev. 1378645325) and 2026 in film (rev. 1379926625), citing Box Office Mojo and The Numbers (S091, S092). Accessed 2026-10-12.
- SourceFederal Reserve Bank of St. Louis. CPI-U, CPIAUCSL (S090). Accessed 2026-10-12.
- SourceRobinson, D. (2019). Analyzing Franchise Revenue — TidyTuesday Screencast. youtu.be/1xsbTs9-a50
- SourceJenkins, H. (2006). Convergence Culture. NYU Press.
- SourceSteinberg, M. (2012). Anime's Media Mix. University of Minnesota Press.
- SourceBox Office Mojo yearly domestic charts (2010–2024) — data/box_office_mojo_yearly_urls.csv.
MethodAssemblyMethod
Shares carry 95% bootstrap ranges (merchandise 44.0–66.2). The 2019 file was audited against Wikipedia revision 904026364 on a 40-franchise random sample (seed 20261012). What changed when we fixed the data.
PlatesMade byImage credits
- HeroArtometrics Franchises illustration.
- PlatePortrait of Luca Pacioli, attributed to Jacopo de' Barbari, c. 1495. Public domain, via Wikimedia Commons.
- PlateColor print of a toy shop, Utagawa Sadahide, 1860. The Metropolitan Museum of Art, CC0, via Wikimedia Commons.
- PlateBelasco Theatre box office, published November 1907 in Architects' and Builders' Magazine. Unknown photographer. Public domain, via Wikimedia Commons.


Updated through OCT 12, 2026.