Executive summary. Research is only as good as its ledger, so we treat corrections as findings. We re-audited the data behind FRANCHISE: Merchandise Owns the Ledger, rebuilt it from Wikipedia's October 2026 list, and recomputed every number we had published. The core finding survives: merchandise is still 55.8% of franchise revenue. Three readings change. Box office looks twice as big, but mostly because it is now counted more completely. Ownership is more concentrated (top five parents 58.2%, up from 46.4%). And the Japan–US comparison reverses.
WHAT WE CHECKED
The original report used the TidyTuesday file of July 2, 2019: 321 rows, 103 franchises, eight revenue categories. It had no missing values or duplicates, but it had 15 placeholder rows under $10 million (Star Wars TV at $0.004B), six cells with leftover Wikipedia citation tags, 59 with stray double spaces, and owner names from 2019 (AT&T, Viacom, Activision Blizzard).
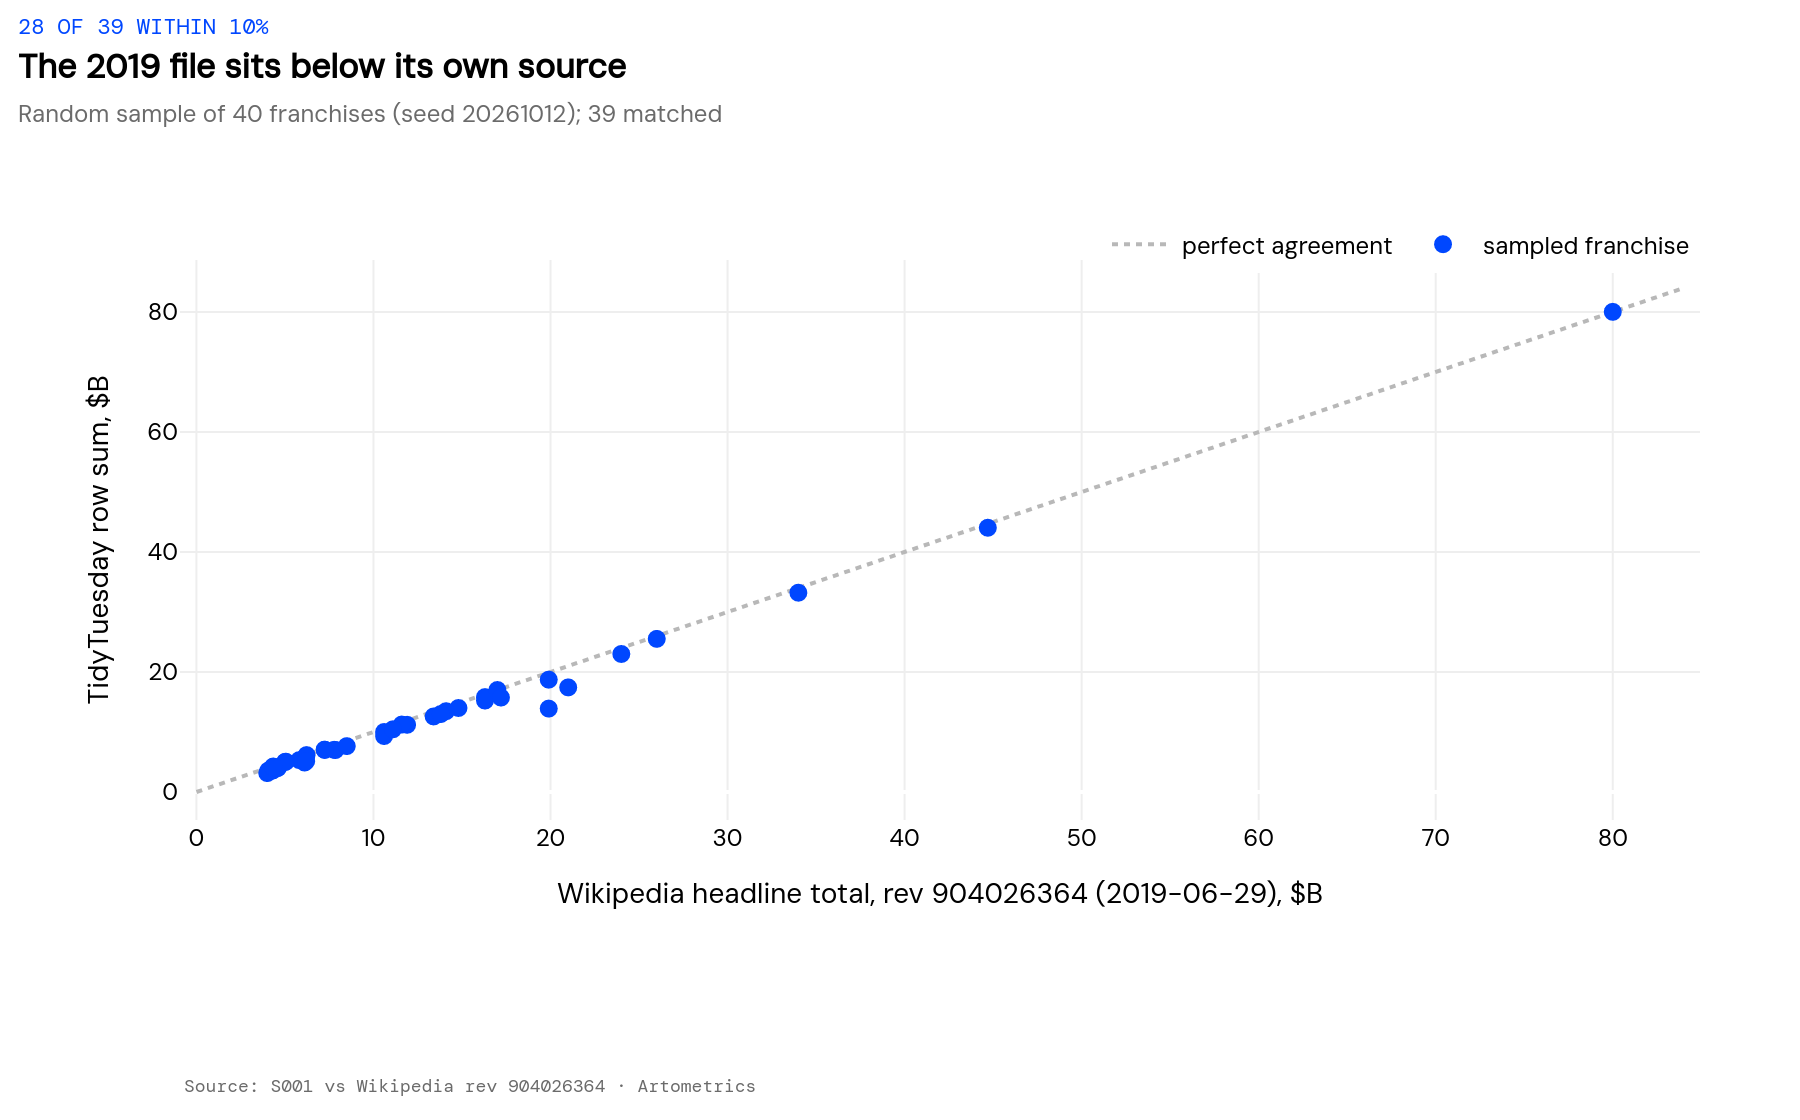
We then checked it against the source it was scraped from — the Wikipedia revision of June 29, 2019 — for a random sample of 40 franchises (seed 20261012). Thirty-nine matched. Only 5 agreed with the itemised breakdown within 1%, and 28 of 39 came within 10% of the headline total. The file was always lower, because its eight-category schema dropped line items that did not fit: card games, theme parks, pachinko. James Bond is the extreme case at $13.9B against $19.9B.
OLD VS NEW
Published is the number in the report before October 2026. Raw new recomputes it from the unchanged 2019 file (every figure reproduces exactly). Clean new uses the rebuilt October 2026 ledger; brackets are 95% bootstrap ranges. Dollar figures are USD billions, nominal.
| Figure | Published | Raw new | Clean new (Oct 2026) | Why it moved |
|---|---|---|---|---|
| Franchises in dataset | 103 | 103 | 140 | Wikipedia's list grew; 82 of 103 franchises carried over, 58 are new, 21 dropped off. |
| Total lifetime revenue | 1522.2 | 1522.2 | 1448.1 | More franchises, but large downward source revisions (Hello Kitty, Mario, Gundam) outweigh them. |
| Merchandise, Licensing & Retail share | 56.0 | 56.0 | 55.8 [44.0–66.2] | Essentially unchanged; the 95% range is wide. |
| Video games share | 20.0 | 20.0 | 17.9 [11.2–26.2] | Slightly lower; mobile-game revenue is now itemised under several franchises. |
| Box office share | 8.9 | 8.9 | 18.3 [12.8–25.6] | Mostly measurement: the 2019 file's eight categories dropped line items, and today's list itemises film grosses more fully. 15.4% on franchises in both vintages. |
| Pokemon lifetime revenue | 90.863 | 90.863 | 130.7 | Seven more years of sales plus a fuller retail estimate ($119.3B). |
| Hello Kitty lifetime revenue | 80.026 | 80.026 | 33.5 | Source revision: editors replaced the older retail estimate. |
| Winnie the Pooh lifetime revenue | 74.519 | 74.519 | 50.2 | Source revision of Disney merchandise estimates. |
| Pokemon 2026 Wikipedia lifetime | 130.7 | 130.7 | Unchanged pair from 2026 list. | |
| Call of Duty 2026 Wikipedia lifetime | 31.0 | 31.0 | Unchanged pair from 2026 list. | |
| Naruto 2026 Wikipedia lifetime | 22.8 | 22.8 | Unchanged pair from 2026 list. | |
| Mortal Kombat 2026 Wikipedia lifetime | 5.06 | 5.06 | Unchanged pair from 2026 list. | |
| Star Wars lifetime | 63.004 | 63.004 | 46.7 | Source revision; merchandise estimate reduced. |
| MCU lifetime | 31.0 | 31.0 | 37.5 | Seven more years of box office (2019–2026 releases). |
| Disney consolidated owner total | 426.209 | 430.69 | Same consolidation rule applied to the 2026 list. | |
| Top-five owner share after Fox consolidation | 46.4 | 58.2 [52.7–72.6] | Consolidation since 2019 (Activision Blizzard into Microsoft, Paramount Skydance) and parents assigned as of 2026. | |
| Top owner share after Fox consolidation | 28.0 | 29.7 [18.2–43.4] | Disney's share barely moves; range shown. | |
| Simpsons 2026 Wikipedia lifetime | 4.9 | 4.9 | Unchanged pair from 2026 list. | |
| Japan region lifetime | 681.494 | 394.46 | Japanese totals revised down at source and several Japanese franchises left the English list. | |
| Japan merchandise share | 49.1 | 71.4 | What remains in Japan's ledger is character-goods engines (Pokémon, Anpanman, Hello Kitty). | |
| US region lifetime | 622.59 | 816.47 | 43 more US-origin franchises on the 2026 list. | |
| US merchandise share | 64.6 | 52.0 | New US entries add box office (MCU) and games (Call of Duty, Fortnite). | |
| Japan franchise count | 42 | 30 | Coverage of the English list; region rules in CLEANING_LOG. | |
| US franchise count | 45 | 88 | Coverage of the English list. | |
| Hello Kitty 2026 Wikipedia lifetime | 33.5 | 33.5 | Unchanged pair from 2026 list. | |
| Mario 2026 Wikipedia lifetime | 9.74 | 9.74 | Unchanged pair from 2026 list. | |
| Gundam 2026 Wikipedia lifetime | 5.0 | 5.0 | Unchanged pair from 2026 list. | |
| Toy Story lifetime | 19.54 | 19.54 | 16.0 | Re-sourced merchandise; Toy Story 5 (2026) not yet fully counted. |
| New: franchise share of worldwide top-10 gross, 2025 releases | 94.4 | |||
| New: franchise share of worldwide top-10 gross, 2026 releases (to Oct 12) | 62.0 | |||
| New: franchises on Oct-2026 list not in ledger | 58 |
WHY THE BIG NUMBERS MOVED
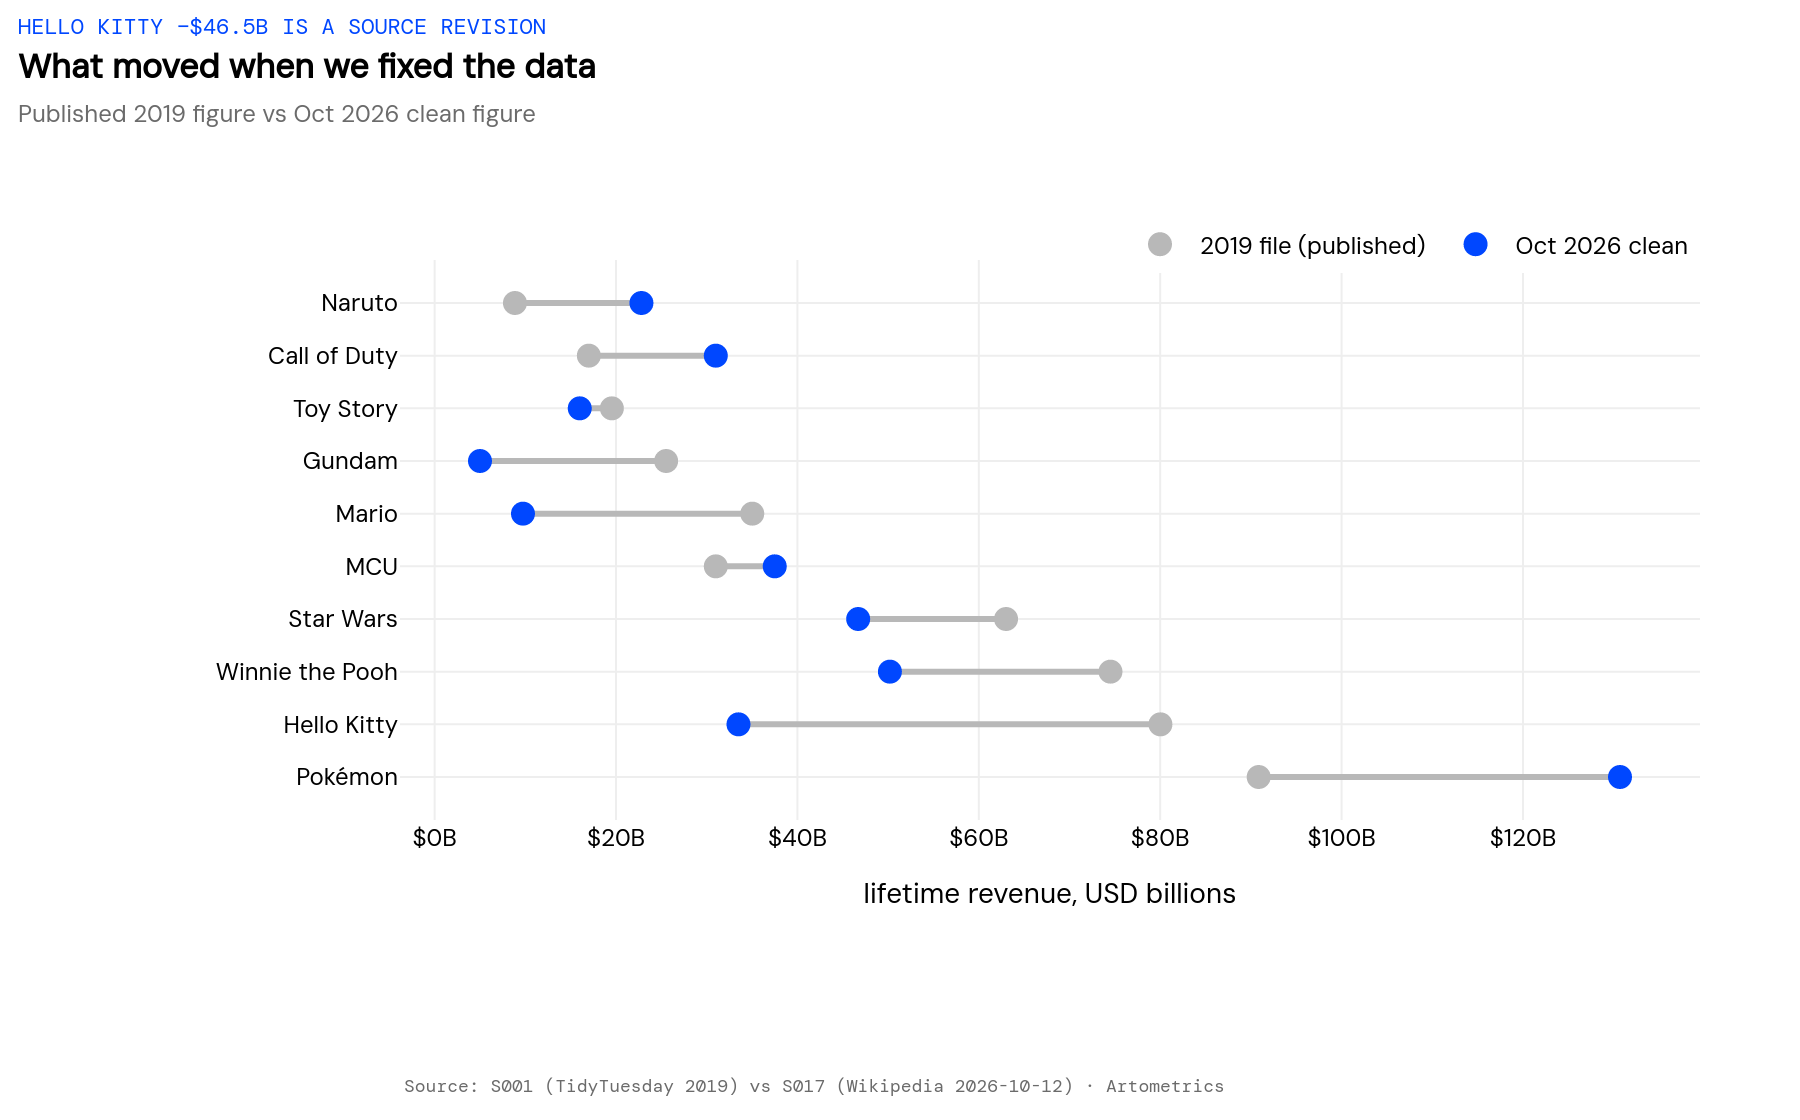
Source revisions, not declines. Hello Kitty ($80.0B→$33.5B), Mario ($35.0B→$9.74B) and Gundam ($25.5B→$5.0B) fell because Wikipedia editors replaced older estimates with better-sourced ones. Neither Sanrio nor Nintendo reported a collapse. We flag these rows rather than quote them as change.
Real growth. Pokémon (+$39.8B), Call of Duty (+$14.0B) and Naruto (+$13.9B) added seven years of sales and newly itemised mobile revenue.
Measurement. Box office went from 8.9% to 18.3% of the ledger. On the 82 franchises in both vintages it is 15.4%, and on franchises above $4B it is 15.0%. Most of the jump is the 2026 list counting theatrical grosses more completely.
Coverage. The list grew from 103 to 140. Forty-three of the 58 additions are US-origin (Fortnite, Avatar, Madden NFL), while Japanese titles such as Detective Conan, Digimon and Bleach left the English table. Together with the downward revisions, that turns “Japan out-earns the US” into “the US out-earns Japan, and Japan is more merchandise-heavy.”
Consolidation. Assigning franchises to today's parents (Activision Blizzard and King into Microsoft, Fox into Disney, Viacom into Paramount Skydance) lifts the top-five share. On the same 2019 franchises it would be 62.8%.
WHAT WE ADDED AND DROPPED
- Added: the full October 2026 ledger (140 franchises, every itemised stream), worldwide top-ten box office for 2025 and 2026, 2026 parent companies, region of origin with documented hand assignments, 95% ranges and sensitivity checks.
- Kept, flagged: the 15 placeholder rows (excluding them changes no share), and $27.2B listed in totals but not itemised (kept as “Unallocated”).
- Not added: streaming revenue, because no free source reports it per franchise in dollars; inflation-adjusted lifetime totals, because they mix decades with no year split; Disney FY2025 segments, which are a pending update.
- Dropped: no rows from the 2019 file. It stays as the audited baseline.
METHOD NOTES
One script rebuilds everything from committed snapshots: scripts/franchise-data/clean_audit.py, with rules R1–R10, flow counts, and sources in CLEANING_LOG.md, METHODS_NOTE.md and DATA_DICTIONARY.md. Sources: Wikipedia “List of highest-grossing media franchises” revisions 904026364 (2019-06-29) and 1379832186 (2026-10-12); “2025 in film” and “2026 in film” (citing Box Office Mojo and The Numbers); FRED CPI-U. All accessed October 12, 2026. Bootstrap: 5,000 resamples of franchises.
LIMITATIONS
Wikipedia figures are editors' estimates of consumer spend, not audited revenue or profit, and they will be revised again. The list is not a random sample, so bootstrap ranges describe sensitivity to which franchises appear, not sampling error. Region and parent coding involve judgment, documented line by line. 2026 box office is still moving. The video versions of FRANCHISE still use 2019 figures and will be re-recorded.
EDITOR'S NOTE
Part of our corrections series: we publish what changed, and why, whenever we fix a dataset. Human editorial direction; AI-assisted analysis per Artometrics workflow.
— Artometrics Editorial Desk