



OCT 12, 2026 · Franchises
Franchises
What Changed When We Fixed the Data
We audited the franchise dataset behind our FRANCHISE report, rebuilt it from Wikipedia's October 2026 list and recomputed every published number. Merchandise still dominates (55.8%), but the Japan–US ranking flipped and Hello Kitty's $80B was a source error.
By Kyle McAuliffe · · 4 min
Executive summary. Research is only as good as its ledger, so we treat corrections as findings. We re-audited the data behind FRANCHISE: Merchandise Owns the Ledger, rebuilt it from Wikipedia's October 2026 list, and recomputed every number we had published. The core finding survives: merchandise is still 55.8% of franchise revenue. Three readings change. Box office looks twice as big, but mostly because it is now counted more completely. Ownership is more concentrated (top five parents 58.2%, up from 46.4%). And the Japan–US comparison reverses.
28 of 39
sampled 2019 franchises within 10% of their own Wikipedia source
55.8%
merchandise share, essentially unchanged from 56.0%
8.9% → 18.3%
box office share, mostly a measurement change
WHAT WE CHECKED
The original report used the TidyTuesday file of July 2, 2019: 321 rows, 103 franchises, eight revenue categories. It had no missing values or duplicates, but it had 15 placeholder rows under $10 million (Star Wars TV at $0.004B), six cells with leftover Wikipedia citation tags, 59 with stray double spaces, and owner names from 2019 (AT&T, Viacom, Activision Blizzard).
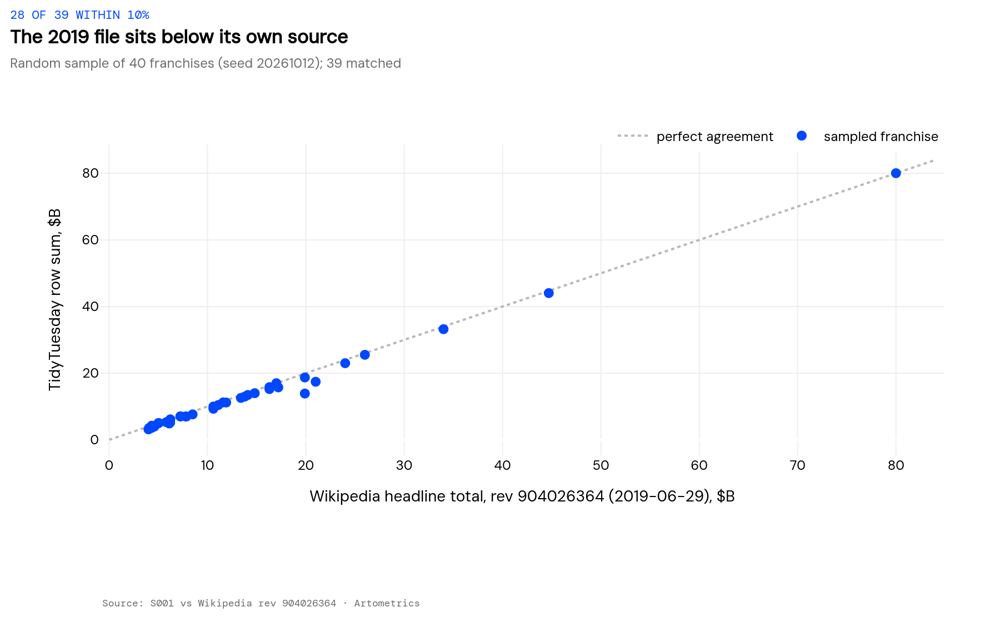
We then checked it against the source it was scraped from — the Wikipedia revision of June 29, 2019 — for a random sample of 40 franchises (seed 20261012). Thirty-nine matched. Only 5 agreed with the itemised breakdown within 1%, and 28 of 39 came within 10% of the headline total. The file was always lower, because its eight-category schema dropped line items that did not fit: card games, theme parks, pachinko. James Bond is the extreme case at $13.9B against $19.9B.
OLD VS NEW
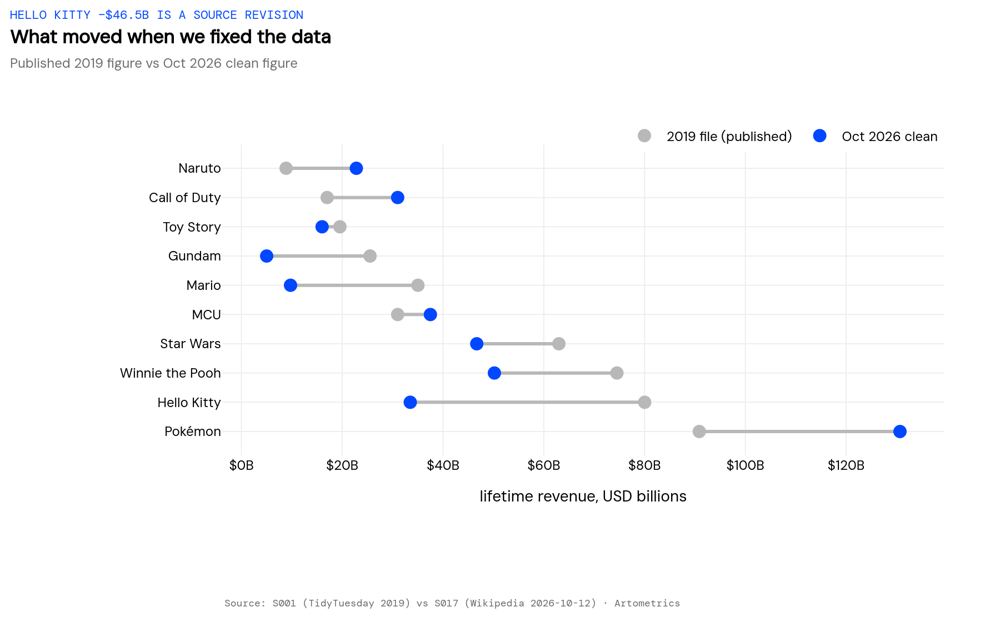
Published is the number in the report before October 2026. Raw new recomputes it from the unchanged 2019 file (every figure reproduces exactly). Clean new uses the rebuilt October 2026 ledger; brackets are 95% bootstrap ranges. Dollar figures are USD billions, nominal.
WHY THE BIG NUMBERS MOVED
Source revisions, not declines. Hello Kitty ($80.0B→$33.5B), Mario ($35.0B→$9.74B) and Gundam ($25.5B→$5.0B) fell because Wikipedia editors replaced older estimates with better-sourced ones. Neither Sanrio nor Nintendo reported a collapse. We flag these rows rather than quote them as change.
Real growth. Pokémon (+$39.8B), Call of Duty (+$14.0B) and Naruto (+$13.9B) added seven years of sales and newly itemised mobile revenue.
Measurement. Box office went from 8.9% to 18.3% of the ledger. On the 82 franchises in both vintages it is 15.4%, and on franchises above $4B it is 15.0%. Most of the jump is the 2026 list counting theatrical grosses more completely.
Coverage. The list grew from 103 to 140. Forty-three of the 58 additions are US-origin (Fortnite, Avatar, Madden NFL), while Japanese titles such as Detective Conan, Digimon and Bleach left the English table. Together with the downward revisions, that turns “Japan out-earns the US” into “the US out-earns Japan, and Japan is more merchandise-heavy.”
Consolidation. Assigning franchises to today's parents (Activision Blizzard and King into Microsoft, Fox into Disney, Viacom into Paramount Skydance) lifts the top-five share. On the same 2019 franchises it would be 62.8%.
■ END
The Fine PrintBack of the BoxEnd Credits
NoteWarningsDisclaimer
Artometrics data brief. Figures come from the sources below. Derived shares and editorial indices are not audited financials.
SourcesContentsSources
- SourceThe original report used the TidyTuesday file of July 2, 2019: 321 rows, 103 franchises, eight revenue categories. It had no missing values or duplicates, but it had 15 placeholder rows under $10 million (Star Wars TV at $0.004B), six ce…
- SourceWikipedia “List of highest-grossing media franchises” revisions 904026364 (2019-06-29) and 1379832186 (2026-10-12)
- Source“2025 in film” and “2026 in film” (citing Box Office Mojo and The Numbers)
- SourceFRED CPI-U. All accessed October 12, 2026. Bootstrap: 5,000 resamples of franchises.
- ReportFull report: artometrics.com/franchise-data-fix
MethodAssemblyMethod
Numbers in this issue are the published figures. The skin changes type, rules, and chart color only.
PlatesMade byImage credits
- HeroArtometrics Franchises illustration.
- PlatePortrait of Luca Pacioli, attributed to Jacopo de' Barbari, c. 1495. Public domain, via Wikimedia Commons.
- PlateColor print of a toy shop, Utagawa Sadahide, 1860. The Metropolitan Museum of Art, CC0, via Wikimedia Commons.
- PlateBelasco Theatre box office, published November 1907 in Architects' and Builders' Magazine. Unknown photographer. Public domain, via Wikimedia Commons.


Updated through OCT 12, 2026.