



JUN 15, 2026 · Netflix
Netflix
Squid Game Season 2 Logged 730 Million Hours on Netflix
Squid Game Season 2 logged 730 million hours viewed on Netflix — 292 times the 2.5 million-hour catalog median across 27,803 titles.
By Kyle McAuliffe · · 3 min

Squid Game Season 2 logged 730 million hours viewed on Netflix — 292 times the 2.5 million-hour median across 27,803 titles from 2010–2025.
The catalog median rose 18% from 5.7 million in the earliest report window to 6.7 million in the latest, signaling a higher middle even as mega-hits define the ceiling. The top dozen titles hold a median of 411 million hours, confirming sustained concentration at the head.
730,000,000
Hours viewed by Squid Game Season 2, the top title
2,500,000
Median hours viewed across the catalog, 292× below the leader
27,803
Title records spanning 2010–2025 in the working dataset
How the pattern changed over time
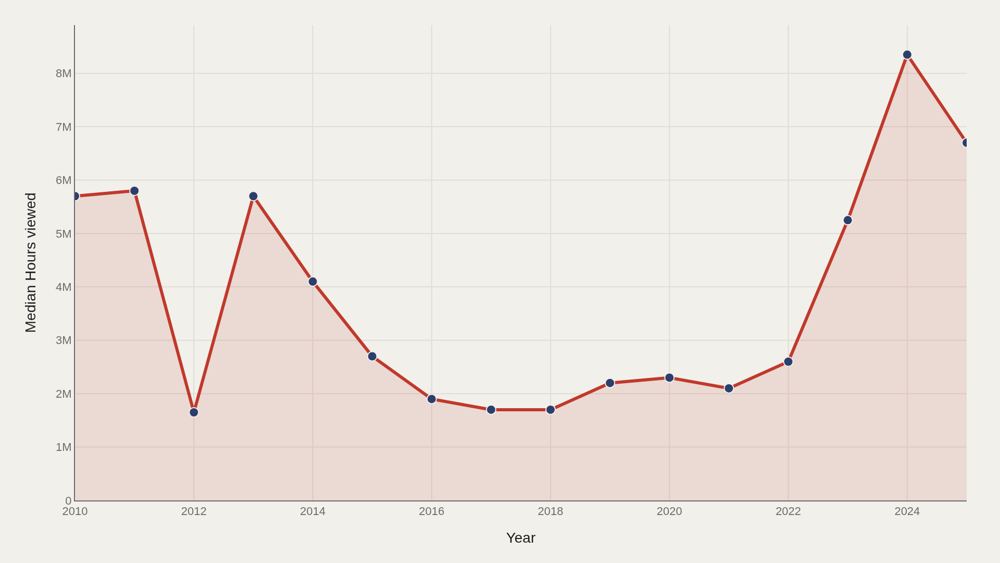
The catalog median rose 18% from 5.7 million hours in the opening period to 6.7 million at the close — a higher middle even as individual mega-hits define the headlines. Engagement tables mix report windows and title types; the trend reflects a shift in the reported middle, not a claim that every viewer watches more.
Who sits at the top
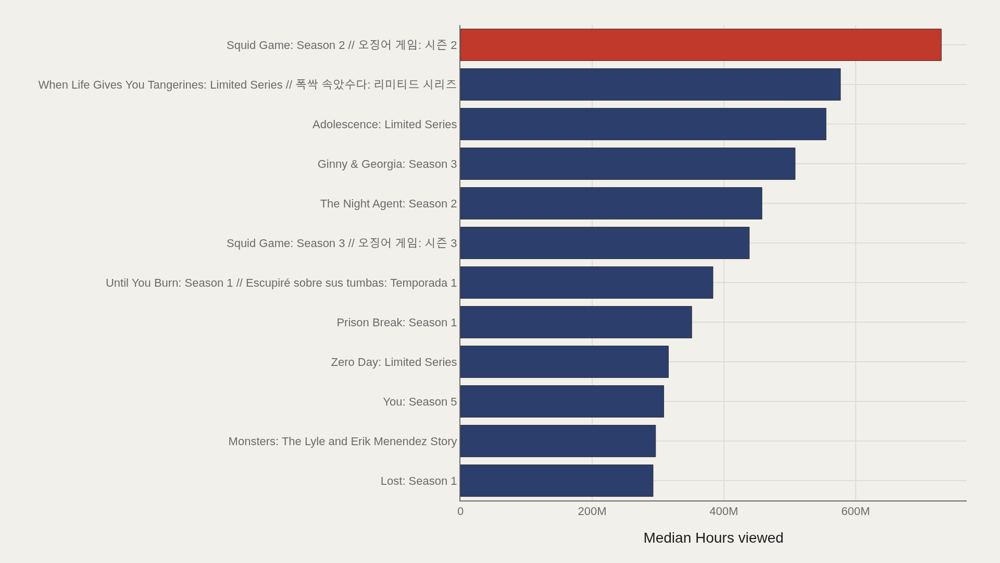
Squid Game: Season 2 // 오징어 게임: 시즌 2 logged 730 million hours. Among the top dozen, the median is 411 million — elevated, but not a single lonely spike. Global event titles dominate the ceiling. Below that head is a long descent into ordinary catalog hours.
How the field is spread
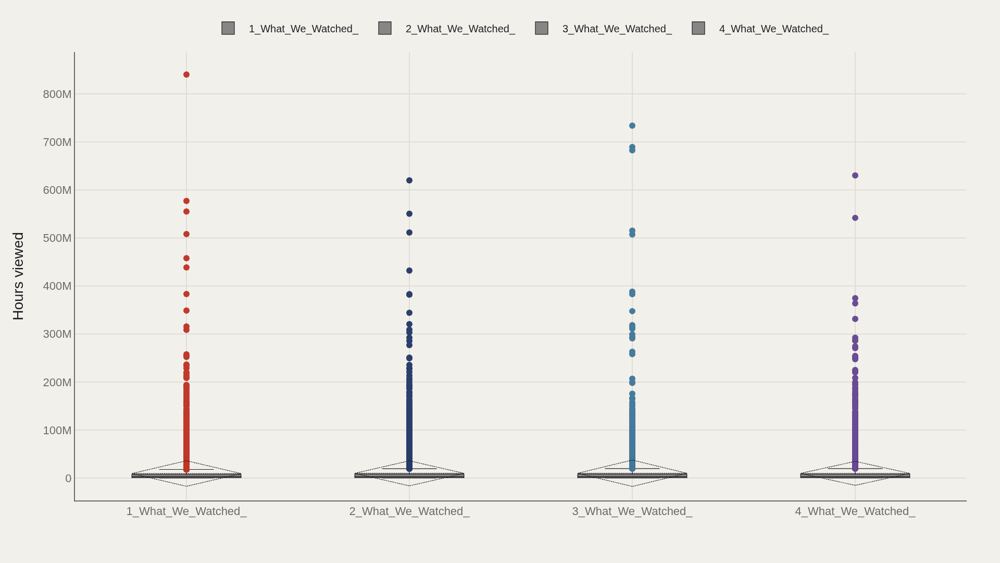
Hours viewed by engagement-report source show whether different publication windows share the same middle or disagree about typical scale. Report vintages are not identical instruments. Comparing boxes across sources reveals stability — or drift — in how Netflix's tables describe the catalog.
Who beats the median — and who trails
3_What_We_Watched_A_Netflix_Engagement_Report_2024Jan-Jun sits 100,000 above the median; 1_What_We_Watched_A_Netflix_Engagement_Report_2025Jan-Jun trails by 200,000. Those gaps are modest relative to the hundreds of millions at the title ceiling. Source-to-source differences matter most when interpreting medians across report windows.
What moves together
Hours viewed and views rise together for many titles, but runtime and completion behavior leave clusters that a single ranking would hide. A short title can rack up views without matching a long series' hour total. The scatter is where that distinction appears.
What to take away
Hours viewed concentrate at the top: Squid Game: Season 2 leads at 730 million, while the catalog median sits at 2.5 million. Leaders, report-window gaps, and the hours-versus-views scatter each answer a different question about attention.
Treat the charts as a map of published engagement tables — then check the source window before turning any title into a platform strategy claim.
■ END
The Fine PrintBack of the BoxEnd Credits
NoteWarningsDisclaimer
Artometrics data brief. Figures come from the sources below. Derived shares and editorial indices are not audited financials.
SourcesContentsSources
MethodAssemblyMethod
Numbers in this issue are the published figures. The skin changes type, rules, and chart color only.
PlatesMade byImage credits
- HeroArtometrics Netflix illustration.
- PlatePortrait of Luca Pacioli, attributed to Jacopo de' Barbari, c. 1495. Public domain, via Wikimedia Commons.
- PlateColor print of a toy shop, Utagawa Sadahide, 1860. The Metropolitan Museum of Art, CC0, via Wikimedia Commons.
- PlateBelasco Theatre box office, published November 1907 in Architects' and Builders' Magazine. Unknown photographer. Public domain, via Wikimedia Commons.


Updated through JUN 15, 2026.