



APR 21, 2026 · Hospitals
Hospitals
The 3% Stick Medicare Keeps Swinging
In CMS's latest Hospital Readmissions Reduction Program extract, 48.15% of hospital–condition pairs still exceed the expected readmission ratio after a decade of penalties capped at 3% of Medicare payments. This R2 report maps HRRP history, who pays, safety-net effects, observation and mortality debates, international comparators, and eight charts for hospital executives.
By Kyle McAuliffe · · 5 min
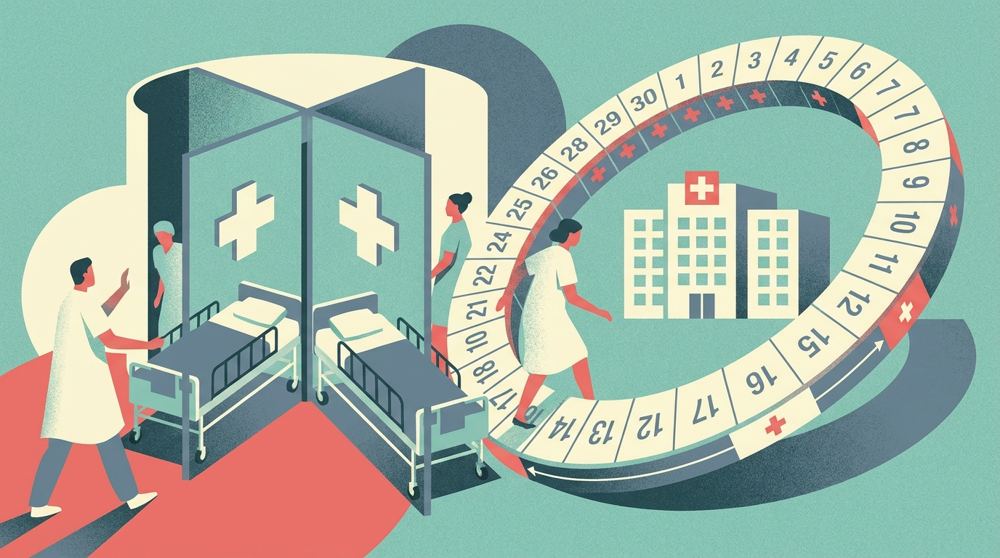
In 2009, Jencks and colleagues reported that nearly one in five Medicare fee-for-service patients returned to the hospital within thirty days. Congress answered with the Hospital Readmissions Reduction Program (HRRP): starting in October 2012, CMS began shaving inpatient prospective payment system (IPPS) dollars when risk-standardized thirty-day readmissions exceeded targets for six conditions. The maximum cut rose from 1% in fiscal year 2013 to 3% in FY2015, and it applies to all Medicare DRG payments—not just the condition that missed (CMS, QualityNet; MedPAC, 2024).
48.15%
hospital–condition pairs with ERR > 1.0 in CMS dataset 9n3s-kdb3 (n = 11,720 pairs)
3%
maximum Medicare IPPS payment reduction under HRRP since FY2015
65.4%
New Jersey share of pairs above ERR 1.0 (highest state)
EXECUTIVE SUMMARY
What it means. Medicare still penalizes roughly half of measured hospital–condition pairs for excess thirty-day readmissions, with elective joint surgery posting the highest average ERR and for-profit systems carrying more high-tier exposure than non-profits.
HRRP SINCE 2012: CAP, PEERS, AND WHO PAYS
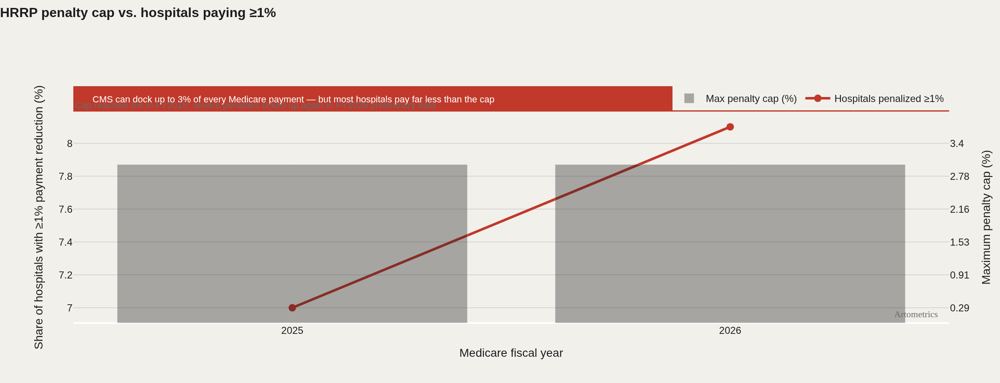
HRRP is a hospital-level payment adjustment, not a per-readmission fine. CMS multiplies a hospital-specific factor into Medicare operating DRG payments for the fiscal year. Who pays? The hospital’s Medicare revenue pool—finance, not quality officers, feels the hit first. Teaching hospitals and safety-net systems still compete inside peer groups defined by dual-eligible (Medicare–Medicaid) proportion so a suburban elective center is not always the comparator (CMS QualityNet HRRP documentation).
NATIONAL READMISSIONS FELL, THEN PLATEAUED
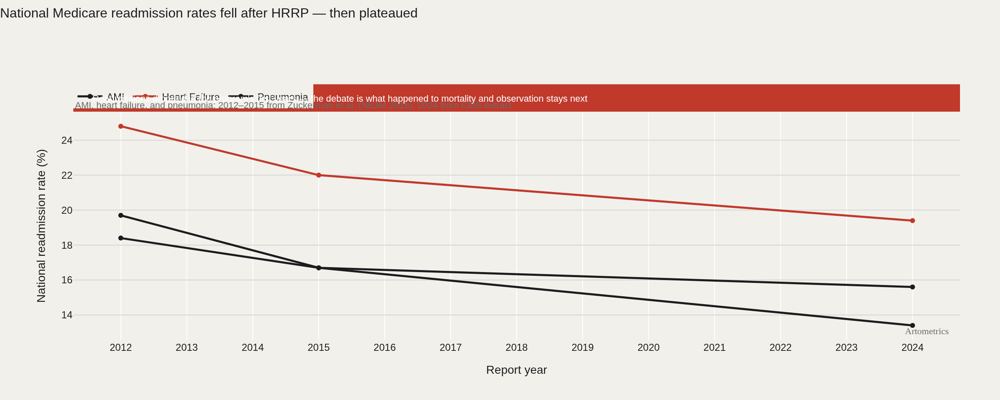
Zuckerman et al. documented declining national readmission rates for targeted conditions after HRRP while observation stays rose—returns that never achieved inpatient status do not enter the ERR numerator. That does not prove gaming; it shows the metric and the clinical pathway diverged. Gupta et al. (BMJ, 2019, doi:10.1136/bmj.l4563) quantified broader thirty-day revisit burdens beyond the HRRP denominator.
The Geography of Failure
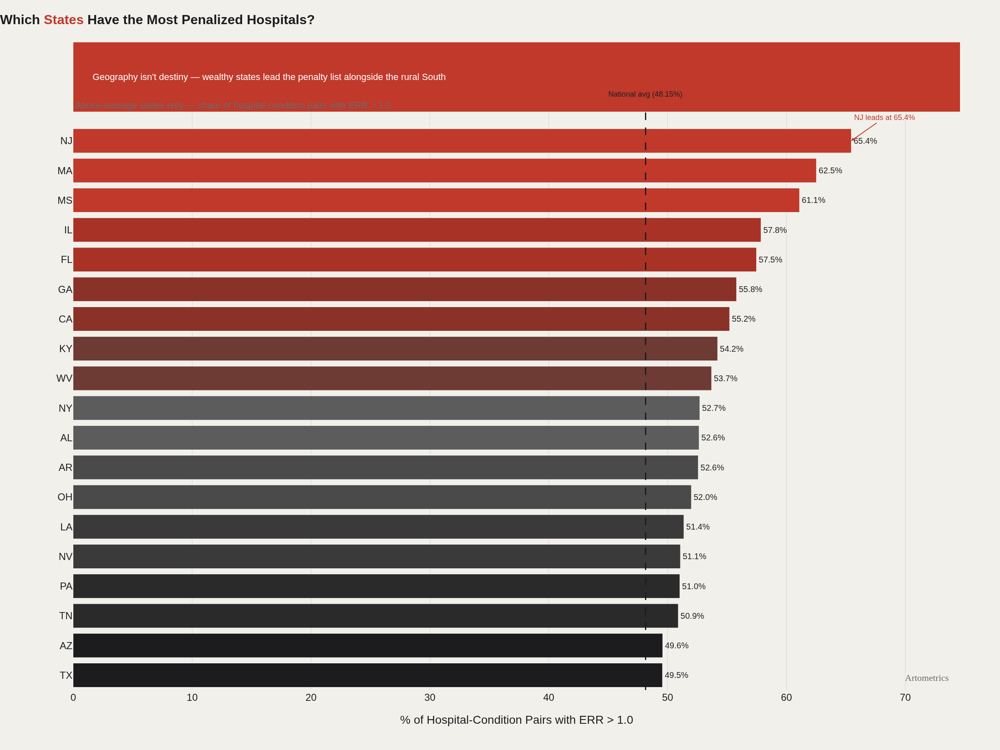
New Jersey leads the country at 65.4%—nearly two of every three hospital-condition pairs in the state perform worse than CMS models expect. Massachusetts (62.5%) and Mississippi (61.1%) follow. New Jersey hosts high-revenue systems such as Hackensack Meridian and RWJBarnabas; Massachusetts concentrates academic medical power around Mass General Brigham; Mississippi is rural, high-poverty, and chronically under-served. Different systems, different patient mixes, same penalty outcome. Georgia, Kentucky, West Virginia, Alabama, and Louisiana cluster high—which fits the familiar population-health narrative. So do Illinois, California, New York, and Pennsylvania. This is not a rural-poverty map with a clean boundary. High-resource markets do not immunize a system. Chart 1 shows only states above the national average—the cohort pulling the 48.1% mean up. Even below-average states are not clean. "Below average" means a smaller share of pairs exceed ERR 1.0, not zero penalties.
The Condition Nobody Is Solving
Hip and knee replacement posts the highest average ERR in this extract (1.004), ahead of CABG, AMI, pneumonia, heart failure, and COPD. The gaps live in the fourth decimal—and still matter multiplied across roughly one million U.S. joint replacements annually. All six conditions average above 1.0. COPD’s lower ERR reflects a sicker expected baseline in CMS’s model, not a victory on absolute returns.
SAFETY-NET PRESSURE AND TEACHING HOSPITALS
Joynt and Jha (JAMA, 2013) showed early HRRP penalties disproportionately hit teaching and safety-net hospitals—systems with more complex patients and thinner margins. CMS later refined peer grouping by dual proportion, but academic corridors still dominate intensity lists: Massachusetts averages 1.034 ERR in this file while New Jersey leads on breadth (65.4% of pairs penalized). Mass General Brigham, Beth Israel Deaconess, and Hackensack Meridian sit in those states; the data do not prove causation, but they show where episode-based models such as TEAM will land first.
OBSERVATION STAYS AND THE MORTALITY DEBATE
Observation status is the accounting escape hatch. When a return is billed as observation, it is not an inpatient readmission in HRRP math. Zuckerman et al. tied observation growth to HRRP’s early years. Wadhera et al. (JAMA, 2018, doi:10.1001/jama.2018.19232) reported associations between HRRP implementation and post-discharge mortality trends for heart failure—sparking a policy fight, not a settled verdict. Krumholz et al. (JAMA, 2017, doi:10.1001/jama.2017.8444) cautioned that hospitals can lower readmissions without improving survival. Dzau and McClellan’s NEJM perspective (doi:10.1056/NEJMp1901225) argued for rebooting incentives toward outcomes, not single metrics.
CONCLUSION
48.1% of hospital-condition pairs still exceed CMS's expected readmission rate—but the distribution is uneven. The highest-penalty states cut across market type and regional demographics. Hip/Knee replacement sits nearly 2× above the next closest condition on excess readmissions. For-profit hospitals carry modestly more penalty exposure than non-profits, though all three ownership types remain majority no-penalty.
■ END
The Fine PrintBack of the BoxEnd Credits
NoteWarningsDisclaimer
Artometrics data brief. Figures come from the sources below. Derived shares and editorial indices are not audited financials.
SourcesContentsSources
- SourceJencks, S.F., Williams, M.V., & Coleman, E.A. (2009). Rehospitalizations among Patients in the Medicare Fee-for-Service Program. NEJM, 360(14), 1418–1428. doi:10.1056/NEJMsa0803563
- SourceJoynt, K.E., & Jha, A.K. (2013). Characteristics of hospitals receiving penalties under the Hospital Readmissions Reduction Program. JAMA, 309(4), 342–343. doi:10.1001/jama.2012.94856
- SourceCenters for Medicare & Medicaid Services. Hospital Readmissions Reduction Program (HRRP) — FY2025 Supplemental Data. CMS Provider Data Catalog, Dataset ID: 9n3s-kdb3. https://data.cms.gov/provider-data/dataset/9n3s-kdb3
- SourceCenters for Medicare & Medicaid Services. Hospital General Information. CMS Provider Data Catalog, Dataset ID: xubh-q36u. https://data.cms.gov/provider-data/dataset/xubh-q36u — joined to HRRP data for ownership classification in Chart 3.
- SourceCenters for Medicare & Medicaid Services. (2024). Transforming Episode Accountability Model (TEAM). https://www.cms.gov/priorities/innovation/innovation-models/team — mandatory participation effective January 1, 2026 for 742 hospitals.
- SourceMedicare Payment Advisory Commission. (2024). Report to the Congress: Medicare Payment Policy, Chapter 9 (hospital inpatient and outpatient services; readmissions discussion). https://www.medpac.gov
- SourceZuckerman, R.B., Sheingold, S.H., Orav, E.J., Ruhter, J., & Epstein, A.M. (2016). Readmissions, observation, and the Hospital Readmissions Reduction Program. New England Journal of Medicine, 374(16), 1543–1551. https://doi.org/10.1056/NE…
- SourceKrumholz, H.M., et al. (2017). Association of Changing Hospital Readmission Rates With Mortality Rates After Hospital Discharge. JAMA, 318(3), 270–278. doi:10.1001/jama.2017.8444
- SourceWadhera, R.K., et al. (2018). Association of the Hospital Readmissions Reduction Program With Mortality Among Medicare Beneficiaries Hospitalized for Heart Failure, Acute Myocardial Infarction, and Pneumonia. JAMA, 320(24), 2542–2552. do…
- SourceGupta, A., et al. (2019). Hospital revisits within 30 days after discharge for medical conditions targeted by the Hospital Readmissions Reduction Program in the United States. BMJ, 366, l4563. doi:10.1136/bmj.l4563
- SourceDzau, V.J., & McClellan, M.B. (2019). The Hospital Readmissions Reduction Program — Time for a Reboot. NEJM perspective. doi:10.1056/NEJMp1901225
- SourceAdvisory Board (2024, 2025). Analyses of CMS preliminary HRRP payment-reduction files for FY2025 and FY2026. FY2025 chart; FY2026 chart.
- SourceOECD (2023). Health at a Glance 2023: OECD Indicators — hospital readmission indicators. oecd.org
- SourceFull bibliography: articles/readmitted/references.bib. Image credits: articles/readmitted/CREDITS.md.
- ReportFull report: artometrics.com/readmitted
MethodAssemblyMethod
Numbers in this issue are the published figures. The skin changes type, rules, and chart color only.
PlatesMade byImage credits
- HeroArtometrics Hospitals illustration.
- PlatePortrait of Luca Pacioli, attributed to Jacopo de' Barbari, c. 1495. Public domain, via Wikimedia Commons.
- PlateColor print of a toy shop, Utagawa Sadahide, 1860. The Metropolitan Museum of Art, CC0, via Wikimedia Commons.
- PlateBelasco Theatre box office, published November 1907 in Architects' and Builders' Magazine. Unknown photographer. Public domain, via Wikimedia Commons.


Updated through APR 21, 2026.