
APR 14, 2026 · YouTube
YouTube
ON AIRThe Platform's $36B Engine and One Podcast's Borrowed Peak
Alphabet reported $36.1B in YouTube ad revenue in FY2024 while Nielsen puts YouTube at 15.8% of U.S. TV-screen usage (Nielsen Gauge, August 2026, before Nielsen's September 2026 method change). Against that scale, H3 Podcast's Frenemies era tripled monthly views—and set a ceiling the show has not touched since.
By Kyle McAuliffe · · 5 min
Executive summary
YouTube is a disclosed advertising business inside Alphabet, a TV-screen habit in Nielsen's monthly Gauge, and a payout machine for the creator economy. Alphabet reported $36.1 billion in YouTube advertising revenue for fiscal 2024—roughly the same order of magnitude as Netflix's $39.0 billion in total streaming revenue that year, though the two lines measure different things (auction-based ads vs subscription receipts). YouTube said in September 2025 it has paid more than $100 billion to creators, artists, and media companies over the prior four years. YouTube led Nielsen's Media Distributor Gauge with 15.8% of U.S. TV watch-time in August 2026, ahead of Disney (9.3%) and Netflix (7.7%). Nielsen's Media Distributor Gauge placed YouTube at 13.4% of U.S. television usage on TV screens in July 2025, ahead of Disney (9.4%) and Netflix (8.8%) in the same release.
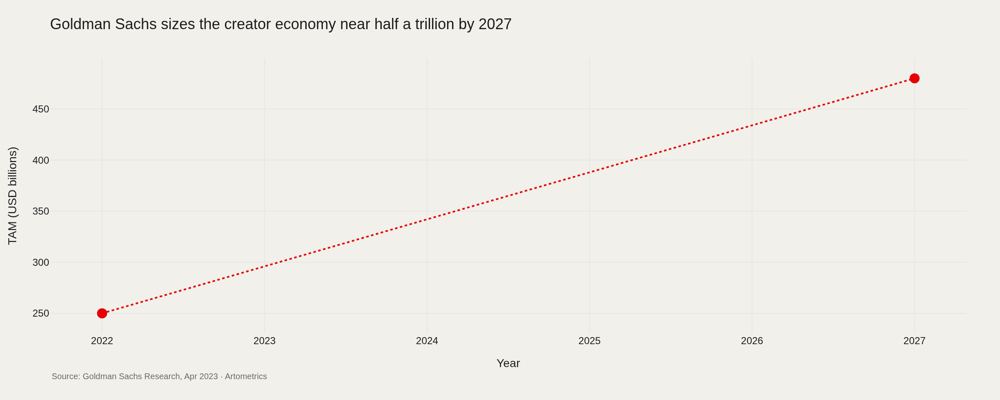
The mechanism underneath those platform numbers is a revenue-share contract. Google documents a 55% partner share of net watch-page advertising revenue on long-form video; Shorts pools pay creators 45% in YouTube's published Partner Program updates. Goldman Sachs Research sized the broader creator economy at about $250 billion in 2022, projecting roughly $480 billion by 2027, with short-form ad monetization as a growth driver— including estimates that Shorts ads could rise from a low single-digit share of YouTube ad revenue toward one quarter of the total by 2027.
$36.1B
YouTube advertising revenue, Alphabet FY2024 10-K
$100B+
paid to creators, artists, and media companies in four years (YouTube, Sep 2025)
15.8%
Nielsen Gauge, August 2026, before Nielsen's September 2026 method change
YouTube ads crossed $36B
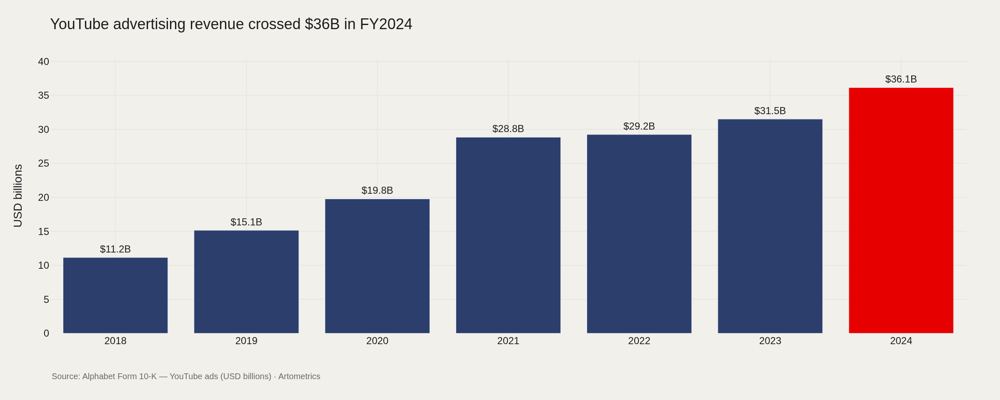
What it means. YouTube is material to Alphabet—not a rounding error inside Google Services. The filing line is narrow (advertising on YouTube properties) and excludes subscription products such as YouTube Premium, YouTube TV, and NFL Sunday Ticket, which Alphabet reports elsewhere.
How we know. Alphabet disaggregates "YouTube ads" in annual 10-K revenue tables. FY2024 reports $36,147 million; FY2022's slowdown to $29.2 billion (+1.4% year over year) preceded re-acceleration to $31.5 billion (FY2023) and $36.1 billion (FY2024).
TV-screen share is now a lead indicator
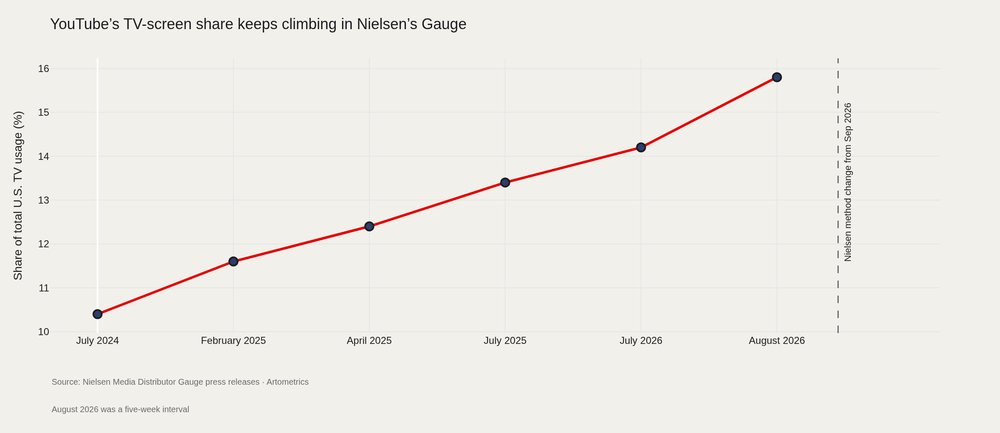
What it means. YouTube competes for living-room attention with Disney, Netflix, and linear bundles—not only for mobile minutes. Nielsen's Media Distributor Gauge ranks media companies by share of time spent watching television; YouTube led in multiple 2024–2025 months.
Creator payouts and the Partner Program split
YouTube's September 2025 Made on YouTube announcement said the platform paid out over $100 billion to creators, artists, and media companies globally over the last four years. CNBC reported the same figure and noted CEO Neal Mohan had cited $70 billion paid between 2021 and 2024 a year earlier—suggesting accelerating payouts, not a flat run rate. These are company statements, not independently audited splits by creator tier.
Shorts vs long-form economics
Shorts is structurally different: lower creator share, feed-based discovery, and CPMs that creators often report as below long-form. Goldman Sachs modeled Shorts advertising rising from about $750 million (2.5% of YouTube ads) in 2023 to about $11.6 billion (26%) in 2027. Alphabet does not publish Shorts revenue separately; treat this as analyst scenario planning.
Cross-market comparisons
TikTok. ByteDance does not publish U.S. TikTok revenue in SEC filings. Goldman Sachs' 2025 creator-economy framing cites third-party estimates of U.S. creator sponsored-content revenue by platform (YouTube largest in their exhibit table) but not TikTok corporate revenue. Regulatory risk (potential ban scenarios) appears in the same research as a reallocation story toward Meta and Google video products—useful strategically, not a clean revenue benchmark.
Case study: H3's borrowed peak
Ethan Klein and Hila Klein built h3h3productions on reaction commentary and Fair Use litigation visibility; the H3 Podcast (2017–) became the family's weekly long-form vehicle. Trisha Paytas joined as co-host for Frenemies in September 2020. Monthly H3 Podcast views roughly tripled against the pre-2020 baseline and collapsed within a month of the June 2021 on-camera breakup. Hasan Piker's Leftovers (2021–2023) produced a secondary bump, not a new peak. Post-2023, output is sparser and longer.
Counterexamples
Guest-forward shows that survived turnover. Hot Ones (First We Feast) rotates guests while growing brand value—the product is the format, not one co-host dyad. H3 inverted that: Frenemies was structurally dependent on Paytas's participation.
Conclusion
YouTube's disclosed economics are those of a major media company: $36.1 billion in FY2024 ads, TV-screen leadership in Nielsen's Gauge months through August 2026, and $100 billion plus paid to creators over four years per YouTube's 2025 statement. The Partner Program still allocates 55% of watch-page ad net revenue to creators on long-form video—while Shorts and music modules complicate the effective rate.
■ END
Notes to the FiguresRatings KeyShow Notes
- Alphabet Inc. Form 10-K FY2018–FY2024. U.S. SEC EDGAR. YouTube ads disaggregation.
- Netflix Inc. Form 10-K FY2024. Total revenue $39,000,966 thousand.
- Nielsen. Media Distributor Gauge, July 2024 (press release 2024-09-03).
- Nielsen. Media Distributor Gauge, February 2025 (press release 2025-03-25).
- Nielsen. Media Distributor Gauge, April 2025 (press release 2025-05-27).
- Nielsen. Media Distributor Gauge, July 2025 (press release August 26, 2025).
- Nielsen. Media Distributor Gauge, July 2026 (press release September 10, 2026).
- Nielsen. Media Distributor Gauge, August 2026 (press release October 22, 2026).
- Nielsen measures TV-screen viewing only, and "YouTube" in The Gauge means YouTube main, excluding YouTube TV.
- Goldman Sachs Global Investment Research. Creator economy primer (Apr 2023; public summary, Apr 19, 2023).
- Google. YouTube Help — partner earnings (answer/72902).
- YouTube Official Blog. Made on YouTube 2025 ($100B+ payouts).
- Artometrics. H3 dataset (Apr 2026).
Updated through: Nielsen Gauge, August 2026 (press release October 22, 2026)